

For weeks before 19 August 2026, bitcoin stayed below about $65,000. Many traders bet it would fall, often with borrowed money. Then bitcoin broke out higher, and their losses grew fast. Exchanges closed those bets by force, which meant buying bitcoin, and that buying pushed the price higher still. The busiest minute came at 15:27 UTC, when about 18,000 bitcoin changed hands on one contract, against about 34 in a normal minute. The price jumped almost $2,900, and three minutes later most of that jump was gone. A candle for that minute shows one tall bar, but it can't show who pushed the price or when they ran out.
Historical bitcoin data, used only to show what order flow looks like. This isn't a view on bitcoin or a suggestion to trade crypto derivatives, which are leveraged and high risk.
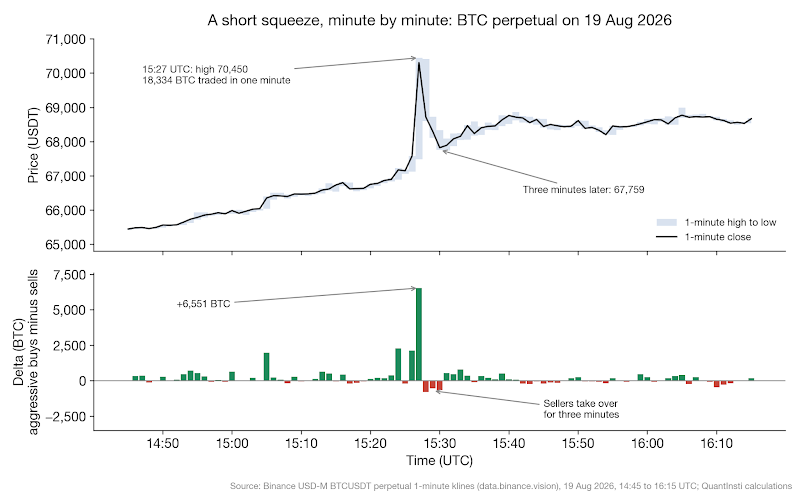
The contract was Binance's bitcoin perpetual future. When an exchange closes a losing short position by force, that's called a liquidation. A rush of forced buying like this one creates a short squeeze. CoinGlass, a firm that tracks this data, counted nearly $2.7 billion of short liquidations that day—a record according to CoinDesk and Bloomberg.
So what would a normal price chart have told you? Very little beyond a big volume number. You wouldn't have seen who was buying. You wouldn't have seen that many of the buyers had no choice. And you wouldn't have seen the moment the buying stopped.
That missing information is what order flow trading tries to read. In this article, we'll replay that bitcoin minute screen by screen. On each screen, we'll ask what you could see and what stayed hidden. Then we'll look at where the method breaks down, and build two key measures in Python.
One warning before we start. We picked this minute after the fact, because it's a clear example. That's hindsight. It shows what order flow looks like. It doesn't show that order flow can predict prices.
What is order flow?
Every price move starts with market and limit orders resting or matching in the order book.
A trade happens when an aggressive market order (the taker) meets a resting limit order.
Order flow is the stream of these orders and trades. Order flow trading watches that stream as it happens, to judge whether buyers or sellers are pushing harder. A candle shows you only the result. The order stream sits much closer to the cause. It isn't the whole cause, though. Prices can also jump on news with few trades, when market makers simply move their quotes.
Isn't this just technical analysis with extra steps? Not quite. Most technical analysis is built on price and, as a distant second, on volume. Patterns, moving averages and support lines all squeeze past trading into tidy shapes. Order flow looks one layer down, at the trades that made those shapes. So it doesn't replace price action trading. It sits next to it. Many traders use it to check what the price chart suggests, or to question it.
What would each screen have shown you?
Order flow traders use five main screens. Each one shows a different slice of the same order stream. Let's go back to 15:27 and look through them one at a time.
The candlestick chart
A candle shows four prices for a period: open, high, low and close. For our minute, it showed a jump from about $67,600 to a high of $70,450. It also showed a big volume bar. That's all it could show.
Why is that a problem? Picture two green candles with the same shape. In the first, buyers paid up for every offer in sight. In the second, a large seller sat near the top and filled everyone who wanted in. The chart draws both bars the same way. But they can mean very different things for the next few minutes.
The order book (Depth of Market)
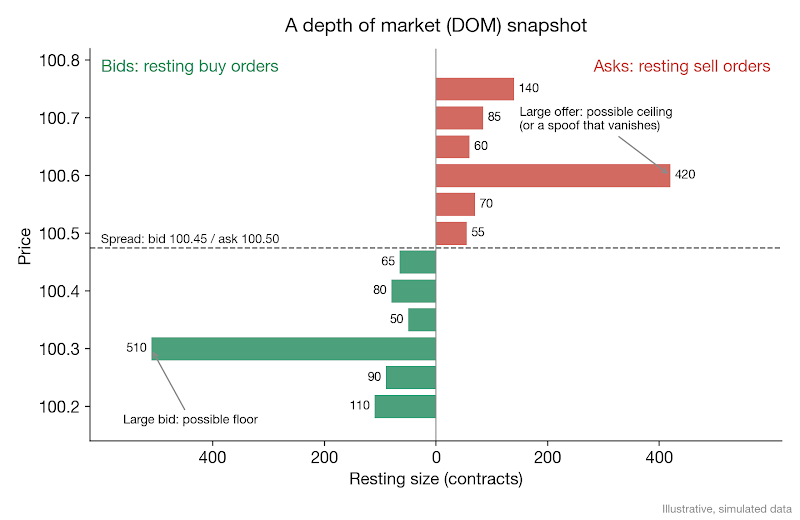
The Depth of Market, or DOM, shows the order book live. Traders also call it Level 2. You see how much people want to buy at each price below the market. You also see how much they want to sell above it.
A big cluster of orders can act as a short-term floor or ceiling. Price has to trade through all that size to get past it. A thin book can let price move fast. But resting orders can be cancelled in an instant. So the book shows what people intend, not what they've committed to.
Can we show you the book from our bitcoin minute? Sadly, no. Binance doesn't include order book history in its free data. Here's a made-up example instead.
The tape (time and sales)
Time and sales, usually called "the tape", is the list of every trade: price, size and time. Reading it is the oldest form of order flow analysis. It goes back to the paper ticker tapes of the late 1800s.
Why look at the tape if you already have the book? Because the tape shows what people did. The book only shows what they say they'll do.
Here's the number that surprised us most. In our one minute, the tape recorded about 145,600 separate trades. A normal minute the day before had about 750. That's more than 2,400 trades a second, far too fast for anyone to read by eye. At that speed, the tape helps you only once software adds it up for you.
The footprint chart and volume profile
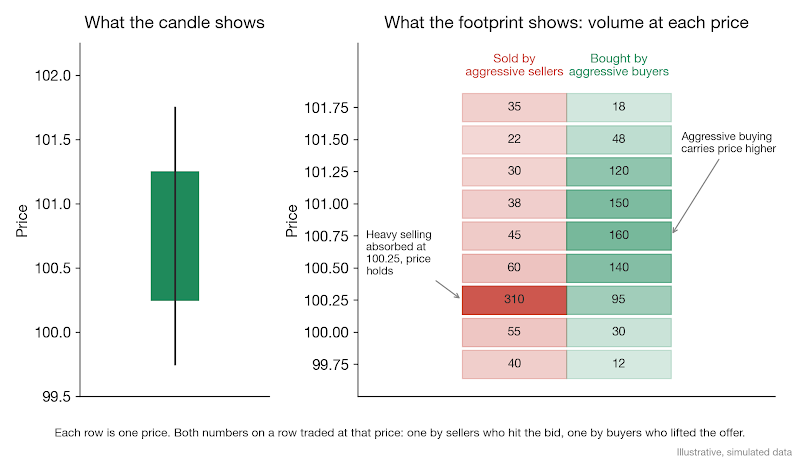
A footprint chart breaks a price bar open. It shows the volume traded at each price inside the bar, split into buying and selling. So where a candle gives you one body, a footprint shows how the trading was spread inside it. This is where patterns like absorption become visible. We'll come to those in the next section.
Could we build a footprint for our bitcoin minute? Not from free data. You need every single trade with its price, and the free one-minute bars only give totals.
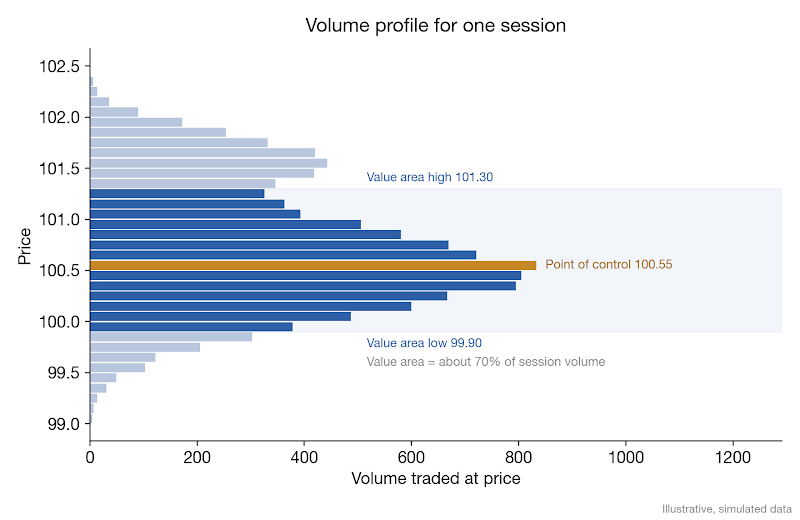
Volume profile is a cousin of the footprint. It shows how much traded at each price over a whole session. Two terms matter here. The point of control is the price with the most volume. The value area is the band around it where most of the trading happened. By convention, it holds about 70% of the session's volume. That figure is a rule of thumb, borrowed from the bell curve, where about two thirds of values sit within one standard deviation of the average. Traders watch both levels because they mark where buyers and sellers agreed most.
Delta
This is the screen where our bitcoin minute comes alive. Delta is aggressive buying minus aggressive selling. It asks how much more the impatient buyers took than the impatient sellers. Cumulative delta is the running total through the session.
Do you need expensive software to see delta? Not always. Some crypto exchanges publish it for free as historical data. Binance's downloadable one-minute futures bars, for example, include a "taker buy volume" column. That's the volume where the buyer was the aggressive side. Take away the rest of the volume (the aggressive selling), and you have delta for every minute.
So what did delta show at 15:27? Aggressive buyers took about 12,400 bitcoin, or about 68% of all trading in that minute. That left delta at about +6,550 bitcoin. Over the four minutes from 15:24 to 15:27, delta added up to about +10,800, and price rose about 5.3%.
Now look at the three minutes after that. Delta turned negative, with sellers ahead by about 2,000 bitcoin. Price fell to $67,759 and gave back about 76% of the four-minute rise.
Which patterns do order flow traders look for?
The screens are only tools. The skill lies in spotting a few situations that keep coming back. These five matter most.
- Absorption: big volume trades at one price, but price barely moves. If heavy selling hits a price and it won't drop, someone large is buying all of it. That can mark a floor.
- Imbalance: one side clearly dominates. On a footprint, you might see far more aggressive buying than selling across several nearby prices.
- Exhaustion: aggressive trading in the direction of the move spikes, then fades. It often suggests fewer people are willing to keep chasing the price.
- Delta divergence: price goes one way while cumulative delta goes the other. It's often read as a warning that the move lacks real order flow behind it. But price can also rise on light buying, simply because sellers have stepped back.
- Large and hidden orders: big resting orders can mark prices that institutions care about. Some are "iceberg" orders, which show only part of their real size and refill as they're hit.
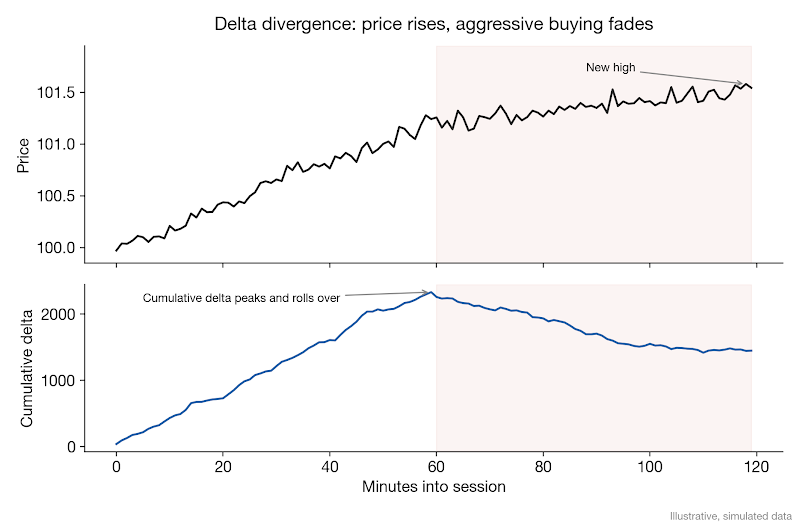
Our bitcoin minute showed two of these back to back. The 15:27 minute was imbalance at its most extreme. The next three minutes looked like exhaustion. So was that a signal to sell? For a few minutes it looked like one. We'll come back to that question at the end.
None of these patterns is a buy or sell signal on its own. Each one is a piece of evidence that you read in context. And they fail often, however convincing the screen looks.
What does the opposite case look like?
The bitcoin minute was buyers overwhelming the book. Now take the reverse, with sellers running into a buyer who won't move. We've simplified it so every piece is visible, and the data is made up.
A futures contract is selling off into support at 100.00. On a candlestick chart, you'd see red bars approaching support, and you'd have to guess what comes next. An order flow screen tells you more.
Aggressive sell orders keep hitting 100.00, and the tape shows heavy volume going through. But price barely moves below it. On the footprint, 100.00 shows large selling volume with almost no downward progress. That's absorption: a resting buyer is taking every market sell. Meanwhile cumulative delta keeps falling, so the sellers are clearly the aggressive side. Yet price stays flat. That's a delta divergence, and it means all that selling isn't turning into lower prices.
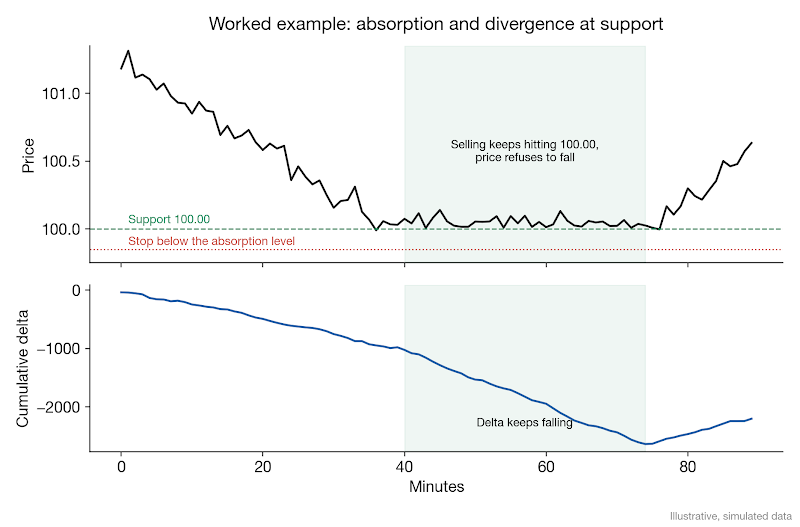
Taken together, these suggest the sellers are using up their orders against one large buyer. An order flow trader might treat that as evidence for a long position. They'd place a stop (an order that exits at a set loss) just below the level where the absorption idea would be proven wrong.
And what if price then breaks cleanly through 100.00 on more selling? Then the idea has failed, and the stop does its job. Traders read this kind of evidence as tilting the odds. But nothing here measures whether it does, or by how much. And it never removes the risk.
Who else is reading the same order flow?
Order flow isn't a retail idea. Its biggest users are professional trading firms, and two kinds matter here.
The first is the market maker. A market maker posts a buy order and a sell order at the same time. It earns the small gap between them, called the bid-ask spread. The danger is being on the wrong side when a large, well-informed buyer arrives. So market makers watch order flow very closely. When aggressive buying piles up, they raise their quotes or pull them. That's one reason a price can jump on very few trades.
The second is the high-frequency trading firm, or HFT firm. The SEC says the term "does not have a settled definition". But it describes these firms as using very fast systems, and as submitting large numbers of orders while cancelling a very high share of them. Many of today's market makers are HFT firms themselves. Their programs react to changes in the order book in microseconds.
Is there evidence that order flow really moves prices? Over very short windows, yes. Rama Cont, Arseniy Kukanov and Sasha Stoikov studied 50 US stocks. They found that "over short time intervals, price changes are mainly driven by the order flow imbalance". That's the gap between buying and selling pressure at the best prices. The effect was stronger when the book was thin. But notice the time scale. Their windows are seconds, not hours or days.
So what does this mean for you? First, you're rarely the fastest reader of the book. By the time a pattern shows up on your screen, these firms have usually already acted on it. Second, large institutions know they're being watched. They split big orders into small slices, or trade off-exchange, so they don't show up as size on the DOM. So the big orders you're hunting for are often the ones somebody failed to hide. For most retail traders, order flow is more useful for understanding a move than for racing professionals to it. It pays to understand how institutional participants trade before you lean on what the DOM shows you.
When can't you trust what the screens show?
Everything above assumes you're seeing the whole market. Often you aren't.
Order flow needs a central order book and real, reported volume. That's why it's most at home in exchange-traded futures, such as index, Treasury, energy and metal futures on the CME. There, trades are matched in one central order book and cleared through one clearing house. So the tape is close to complete. Block trades are the exception. They're arranged away from the screen and reported afterwards.
US stocks give you only part of the picture. They trade across more than a dozen exchanges. And in 2025, about half of all US share volume traded off-exchange (50.6%, by Cboe's count). So one exchange's book shows only a slice, even though every trade does reach the consolidated tape.
Spot forex is the awkward case. It trades over the counter, between banks and brokers, with no single order book and no true volume figure. What retail forex platforms call "volume" is usually a count of price changes from one broker's feed. That's a stand-in for volume, whatever the software calls it.
Crypto has its own gap. Bitcoin trades on dozens of venues at once, so one exchange's delta is never the whole picture. You can see this in the prices. On 19 August, the Binance perpetual reached $70,450. Yahoo Finance's bitcoin spot series topped out at about $69,997 that day. The free data also can't separate forced buying from chosen buying. It tells you buyers were aggressive, not that they were shorts being liquidated. That part comes from trackers like CoinGlass, and CoinDesk points out that even their Binance figures are incomplete. (If crypto is your market, there's a separate post on an order flow strategy for crypto markets.)
Perpetual futures are leveraged products. The liquidations in this example are traders losing their whole margin in minutes, and in leveraged products you can lose more than you put in.
Then there's cost. Real order flow needs tick-by-tick data with very low delay, plus specialised charting software. Both come with monthly bills. If I were starting out, I'd learn the footprint on one liquid futures contract, such as an index future, before paying for anything else.
The data is noisy, too. Spoofing means placing large orders you plan to cancel before they fill. It's banned in US futures markets under the Dodd-Frank Act of 2010, but it still happens. In May 2026, the CFTC fined a New York trader $200,000 for about 50 spoofing episodes, mostly in Ultra Treasury Bond futures. So a big order on the DOM may vanish before price gets there. Trust what actually trades more than what's displayed.
Can you build delta and a footprint in Python?
Yes, and you don't need an expensive platform to see how they work. You need tick data: individual trades with a price, a size and, ideally, which side was the aggressor.
The script below does three things. It works out the aggressive side when the feed doesn't say. It adds up delta and cumulative delta over one-minute bars. Then it builds a footprint for the latest minute.
Treat this as a teaching tool, not a trading system. The tick rule only guesses the aggressor, and the guess gets worse when many trades print at the same price. The one-minute bar is an arbitrary choice. Five minutes, or a fixed number of trades, would work just as well. And delta on thinly traded instruments is unreliable.
Most important of all, nothing here tells you whether absorption or divergence predicts the next move. Before you act on any order flow signal, you'd want to backtest it properly with trading costs included. Treat out-of-sample testing (checking the rule on data it wasn't built on) as a must, not a nice extra.
So what happened after that minute?
Let's go back to 19 August one last time. At 15:27, the delta screen showed extreme buying. Then came three minutes of selling, and price dropped back to $67,759. If you'd read that as exhaustion and sold, you'd have felt clever for a few minutes.
Then the rest of the day played out. Bitcoin closed the day near $69,300 on that contract. The next day, it traded above $73,000. So the exhaustion read was right for three minutes and wrong for the next two days. We didn't expect the turn to be that sharp when we pulled the data.
Free exchange data showed us how one-sided the buying was, and it showed the sellers coming back. It didn't show the order book, the other venues, or which buyers were forced. And nobody watching in the moment could know whether the pullback would last. That gap, between what the screen shows and what you'd need to know, is where most order flow mistakes are made.
That's what makes the bitcoin minute a good way to learn order flow, and a poor reason to trust it. The screens describe what happened. Only a proper test, with costs, can tell you whether a pattern is worth trading.
Interested in algorithmic and quantitative trading?
Schedule a call with an EPAT career counsellor to discuss the right path for your background.
Frequently asked questions
What is order flow trading?
Order flow trading reads the live stream of orders and trades in a market. The aim is to judge whether buyers or sellers are pushing harder. A price chart shows only the result of that trading. Order flow looks at the trades behind it. It asks who was aggressive, and at which prices.
What is the difference between order flow and volume?
Volume tells you how much traded. Order flow adds who started each trade and at what price. Delta is a good example. It takes aggressive buying and subtracts aggressive selling. Two bars can show the same volume yet very different delta. That difference is often what order flow traders care about.
What tools and indicators do order flow traders use?
Most use five main screens. The order book, or Depth of Market, shows resting orders at each price. The tape lists every trade as it happens. Footprint charts and volume profile show how much traded at each price. Delta, and its running total, cumulative delta, measures aggressive buying minus aggressive selling.
Does order flow trading work in forex?
Only in a limited way. Spot forex trades over the counter, between banks and brokers. There's no single order book and no true volume figure. Most retail platforms show a count of price changes from one broker's feed instead. Order flow is more complete in exchange-traded futures, where one central book matches trades.
Is order flow trading suitable for beginners?
It sits at the more advanced end of trading. You need tick-by-tick data, specialised charting software, and a feel for market structure. Both the data and the software usually cost money each month. And the patterns fail often, even when the screen looks convincing. A gentler start is the footprint on one liquid index future.
Can order flow predict where price goes next?
Not on its own. Patterns like absorption or exhaustion are pieces of evidence, not buy or sell signals. They fail often. In one August 2026 bitcoin squeeze, a sell read held for three minutes. Then price kept rising for two days. Only a proper backtest, with costs, can show whether a pattern is worth trading.
Sources
- CoinDesk, "Bearish crypto bets lose record $3 billion as bitcoin tops $71,000", 20 Aug 2026: https://www.coindesk.com/markets/2026/08/20/bearish-crypto-bets-lose-record-usd2-7-billion-as-bitcoin-surges-toward-usd70-000
- Bloomberg, "Crypto Surge Triggers Record $2.7 Billion of Short Liquidations", 19 Aug 2026: https://www.bloomberg.com/news/articles/2026-08-19/bitcoin-surges-most-since-march-ahead-of-white-house-meeting
- Crypto Briefing, "Bitcoin posts best day since February 2026 amid $1B short squeeze", 20 Aug 2026: https://cryptobriefing.com/bitcoin-best-day-short-squeeze-billion/
- Binance, public market data, USD-M futures BTCUSDT 1-minute klines, 18 to 20 Aug 2026: https://data.binance.vision/?prefix=data/futures/um/daily/klines/BTCUSDT/1m/
- Yahoo Finance, BTC-USD daily history (19 Aug 2026): https://finance.yahoo.com/quote/BTC-USD/history/
- CME Group Inc., Form 10-K for fiscal year 2025 (CME Globex central limit order book and CME Clearing): https://www.sec.gov/Archives/edgar/data/1156375/000115637526000009/cme-20251231.htm
- CME Group, "How CME Group Ag Markets Operate" (block trades executed outside the central limit order book): https://www.cmegroup.com/education/articles-and-reports/overview-what-makes-ags-markets-work.html
- Cboe, "2025 U.S. Equities Year in Review" (off-exchange TRF share at 50.6% of volume): https://www.cboe.com/insights/posts/2025-u-s-equities-year-in-review
- CFTC, "Antidisruptive Practices Authority", interpretive guidance, 78 FR 31890, 28 May 2013 (Dodd-Frank section 747 spoofing ban): https://www.govinfo.gov/content/pkg/FR-2013-05-28/pdf/2013-12365.pdf
- CFTC, "CFTC Orders New York Trader to Pay $200,000 for Spoofing", release 9227-26, 6 May 2026: https://www.cftc.gov/PressRoom/PressReleases/9227-26
- SEC, "Concept Release on Equity Market Structure", Release No. 34-61358, 75 FR 3594, 21 Jan 2010 (high-frequency trading): https://www.govinfo.gov/content/pkg/FR-2010-01-21/html/2010-1045.htm
- Cont, R., Kukanov, A. and Stoikov, S., "The Price Impact of Order Book Events", Journal of Financial Econometrics 12(1), 47-88 (preprint): https://arxiv.org/abs/1011.6402
- QuantInsti, Order Book glossary entry: https://quantra.quantinsti.com/glossary/Order-Book
- QuantInsti, Order flow strategy in crypto markets: https://blog.quantinsti.com/order-flow-strategy-crypto-markets/
Order flow sits at the more advanced end of systematic trading, where market microstructure, data handling and strategy design meet. If you want to go further, EPAT, QuantInsti's Executive Programme in Algorithmic Trading, is a practitioner-led programme covering market microstructure, Python, backtesting and risk management. Explore the EPAT curriculum →
If you'd prefer a self-paced start on the coding side, Quantra's Python for trading course covers the data-handling foundations behind the footprint and delta example above.
Disclaimer
This article is for education only. QuantInsti is not registered with SEBI as a Research Analyst or an Investment Adviser, and nothing here is investment advice, a research report or a recommendation to buy, sell or hold any security, fund, index product, currency or crypto asset. Where we name a security, a price or a date, it's there only to illustrate a concept with historical data. It isn't a view on where that price will go.
Past results don't indicate future results, and that applies even more to backtested or simulated results, which are built with hindsight and can leave out costs, slippage and execution limits that change the outcome. Trading involves substantial risk of loss. With leveraged products such as futures, options, CFDs and crypto derivatives, you can lose more than the money you put in.
Do your own research. Before you make any investment or trading decision, consult a SEBI-registered Investment Adviser or Research Analyst who can take your own circumstances into account.