TL;DR This project tests whether trend-following, a strategy family with decades of documented success in futures markets, transfers to spot FX. Three approaches (time-series momentum, moving-average crossover, and channel breakout) were backtested across the seven major currency pairs from 2003 to 2025, using 23 rolling walk-forward windows (3-year train, 1-year test), with parameters chosen for neighbourhood stability rather than peak historical Sharpe ratio.
The verdict is limited tradeability. Only 2 of 7 pairs, USDJPY and EURUSD, both using time-series momentum, clear the 0.5 Sharpe tradeability bar (0.78 and 0.54, respectively). The best multi-currency portfolio, an equal-weighted blend of each pair's best strategy, lands at a 0.43 Sharpe and 1.24% CAGR, just under the threshold. The strategies do show a genuine crisis-alpha effect, averaging 6.20% during the 2008 GFC, 2020 COVID, and 2022 rate-hike windows, and leverage reliably makes things worse rather than better once financing costs and compounding asymmetry are modelled realistically.
About the Author

Project Idea and Motivation
The project topic is trend-following strategies in major currency markets. Trend-following has demonstrated long-term efficacy across a wide range of asset classes (Moskowitz, Ooi & Pedersen, 2012; Hurst, Ooi & Pedersen, 2017), and Shi & Lian (2025) provide a modern, practitioner-oriented framework showing that combining multiple time scales with volatility targeting can enhance performance, particularly in futures markets.
That last word, futures, is the open question this project sets out to test. Futures returns embed roll yields and term premia that are simply absent in spot FX. So how much of the documented "trend premium" actually transfers to currency spot markets, where there's no futures curve to harvest carry from? This project empirically tests which trend-following specifications, if any, deliver robust, risk-adjusted performance in major spot FX pairs, using nothing but price action, volatility targeting, and realistic swap and transaction costs.
Methodology Overview
Data and Universe
| Component | Source | Period |
|---|---|---|
| FX Prices | Stooq | 2000-2026 |
| Interest Rates | FRED (Central Bank Rates) | 2000-2026 |
| FX Pairs | 7 major pairs | 2000-2026 |
The seven pairs are EURUSD, USDJPY, GBPUSD, USDCHF, AUDUSD, USDCAD, and NZDUSD. Stooq was used in place of Yahoo Finance for the final analysis specifically because it extends back to 2000 rather than 2007, which makes the 2008 Global Financial Crisis available for crisis-alpha testing rather than just COVID and the 2022 rate-hike cycle.
Strategies Tested
Three trend-following signal methodologies were implemented, each inheriting from a shared base backtest class with volatility-targeted position sizing, FX swap costs from interest rate differentials, and transaction costs on every position change:
- Time-Series Momentum (TSM): go long if the cumulative return over the lookback period is positive, short if negative.
- Moving-Average Crossover (MA): go long when the fast moving average crosses above the slow moving average, short on the reverse cross.
- Channel Breakout: go long when price breaks above the rolling high, short when it breaks below the rolling low.
| Strategy | Parameters Tested |
|---|---|
| TSM | Lookback: 63, 126, 252 days |
| MA Crossover | Fast: 20, 30, 50 / Slow: 100, 150, 200 |
| Breakout | Channel: 20, 40, 60 days |
All strategies were also tested across a volatility-target grid of 5%, 10%, 15%, and 20% annualized.
Walk-Forward Validation Setup
Rather than fitting each strategy once to the full history, each specification was run through 23 rolling walk-forward windows: a 3-year training period followed by a 1-year out-of-sample test, stepped forward one year at a time from 2003 to 2025. Parameters for each window were chosen using neighborhood stability scoring on the training data alone, not by picking whichever combination produced the best historical Sharpe, with constraints of a minimum of 5 trades and a maximum 25% drawdown. This matters because parameters are never re-selected using fold results, which avoids look-ahead bias and produces a meaningfully more conservative, more honest out-of-sample picture than a single in-sample fit would.
Results
Single-Strategy Performance
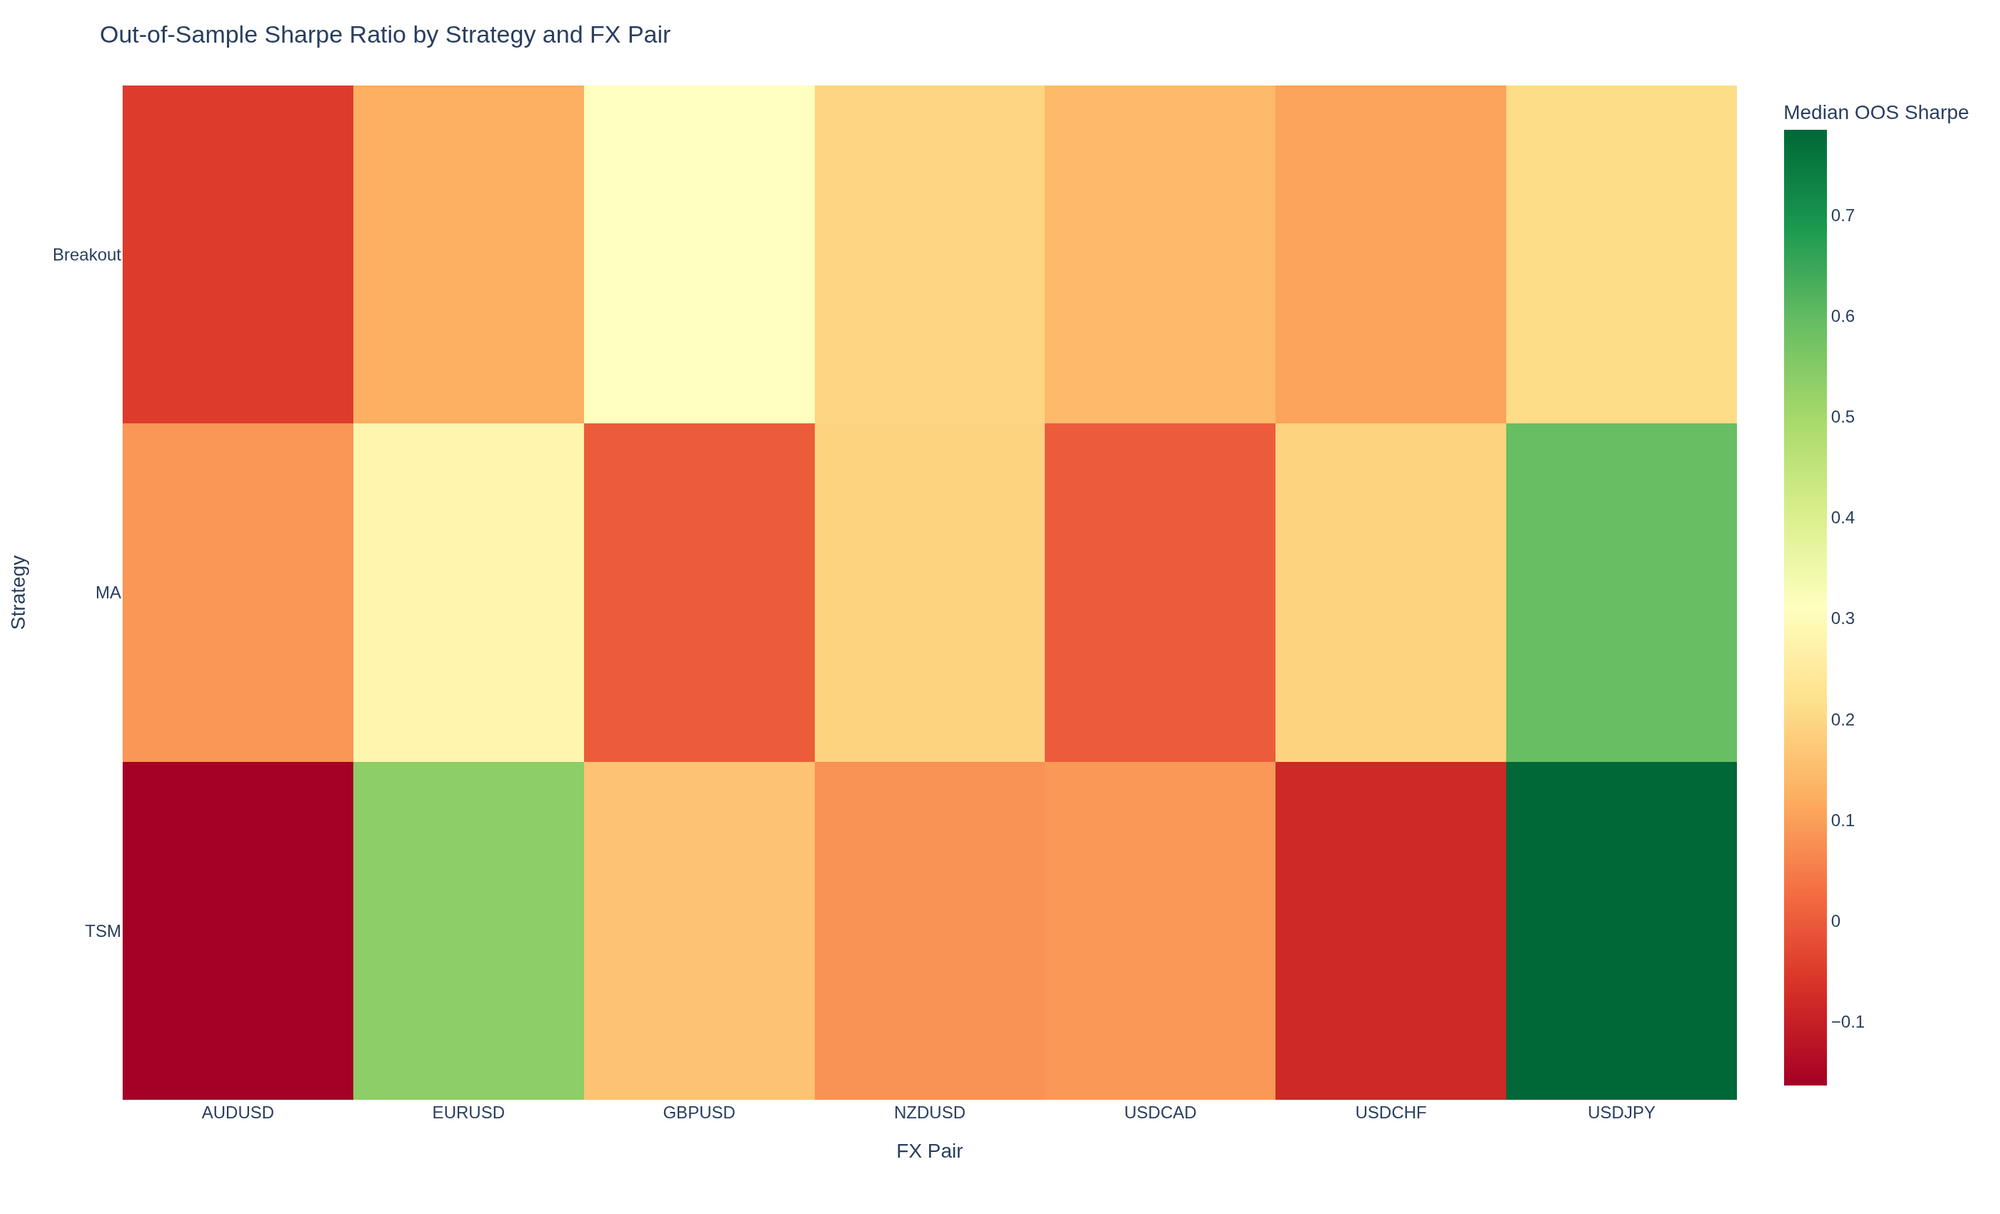
Across all 21 strategy-pair combinations (3 strategies x 7 pairs), only 2 cleared the Sharpe 0.5 tradeability threshold, both on time-series momentum.
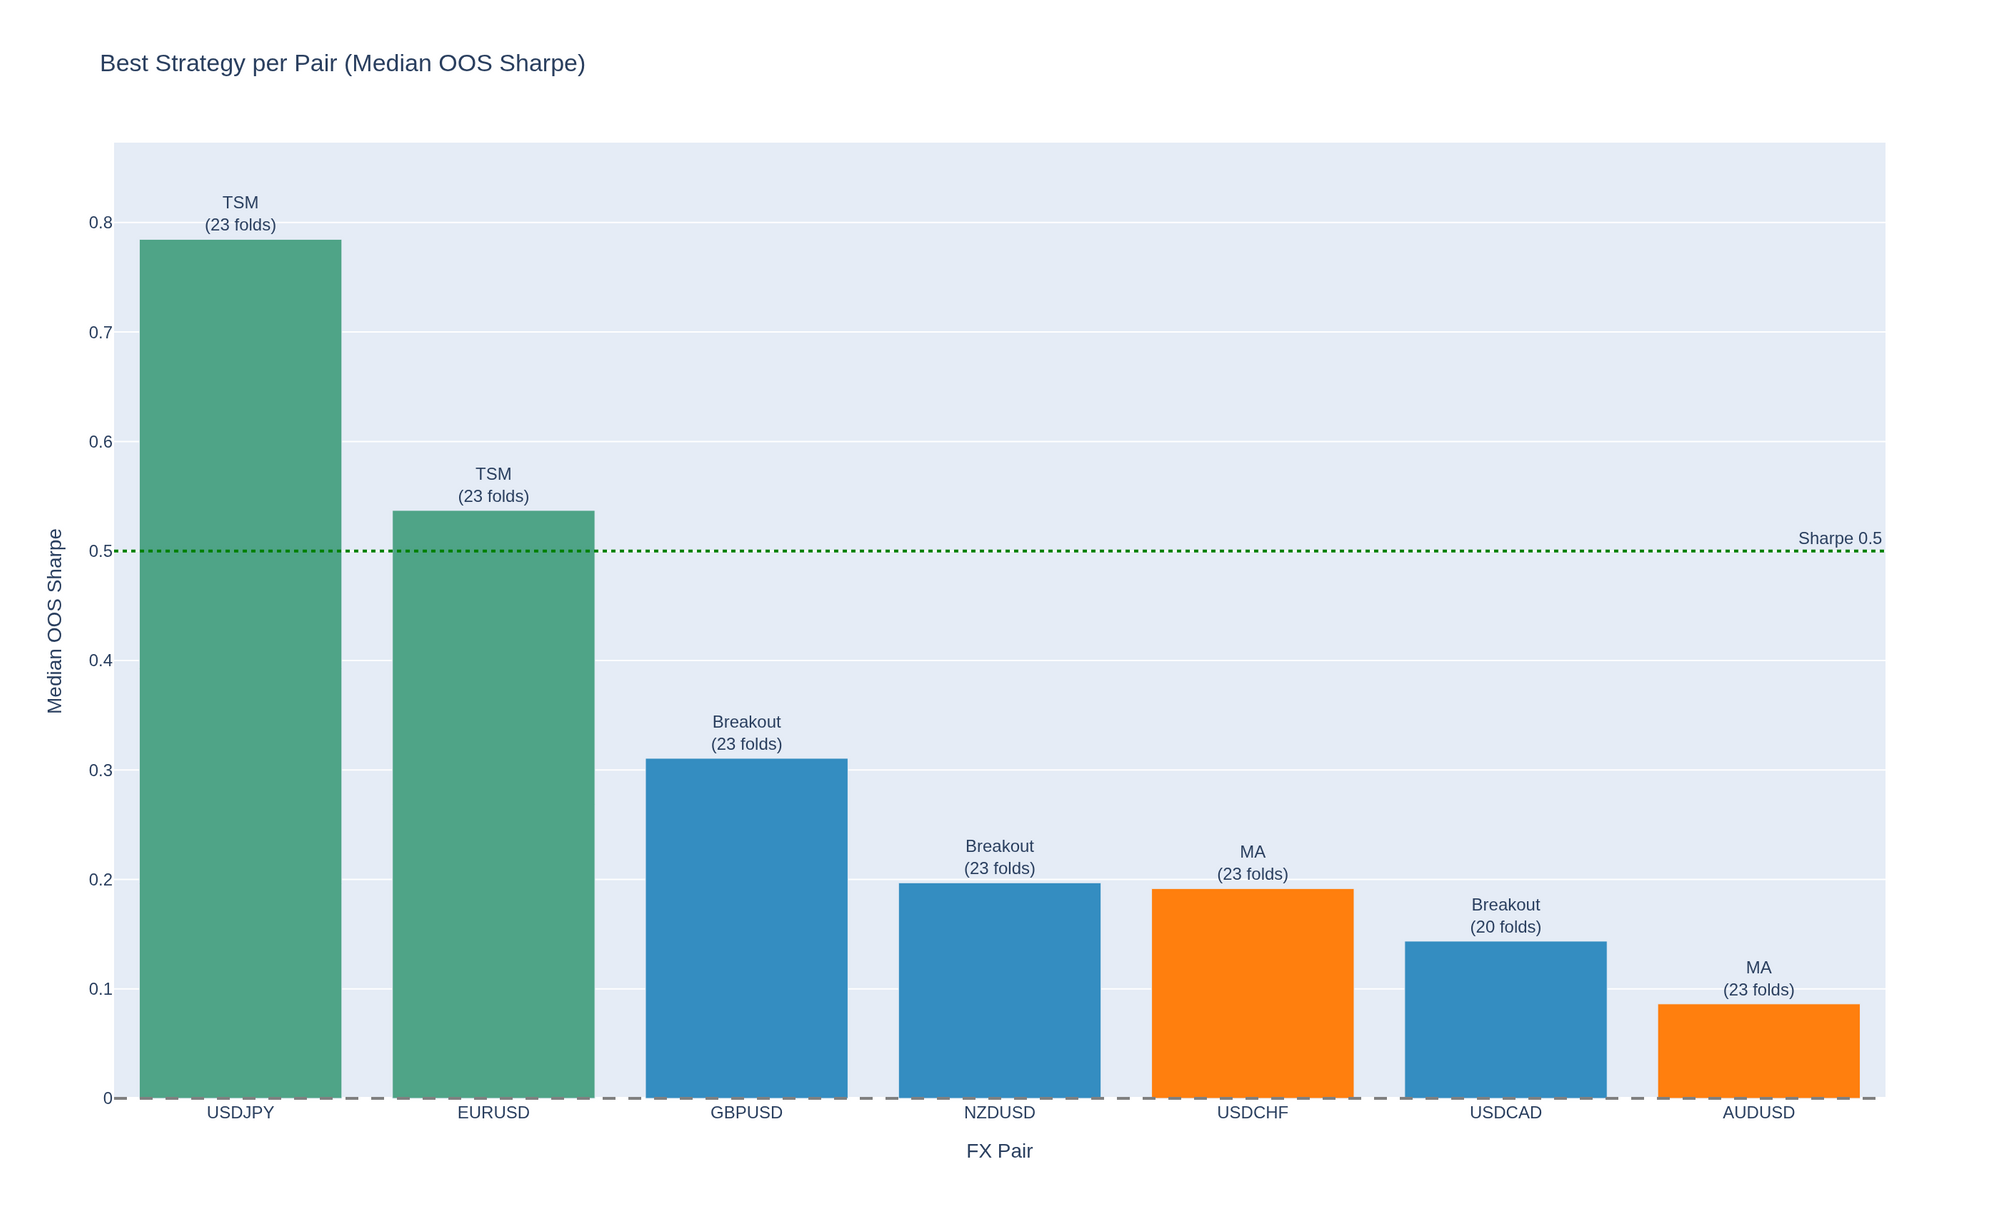
| Pair | Best Strategy | Sharpe | Status |
|---|---|---|---|
| USDJPY | TSM | 0.78 | TRADE |
| EURUSD | TSM | 0.54 | TRADE |
| GBPUSD | Breakout | 0.31 | WATCH |
| NZDUSD | Breakout | 0.20 | WATCH |
| USDCHF | MA | 0.19 | WATCH |
| USDCAD | Breakout | 0.14 | WATCH |
| AUDUSD | MA | 0.09 | WATCH |
USDJPY TSM is the standout, comfortably exceeding the 0.78 threshold. EURUSD TSM also clears it at 0.54. The remaining five pairs are all positive but sub-threshold, and AUDUSD is weak across every strategy tested on it, consistent with its character as a carry-sensitive pair where swap costs eat into trend signals.
Multi-Currency Portfolio Construction
Two portfolio construction approaches were tested on top of the single-strategy results: equal weighting all seven pairs, and risk parity (inverse-volatility weighting). Six per-strategy portfolios were built (TSM, MA, and Breakout, each equal-weighted and risk-parity-weighted), plus two "best strategy" portfolios that pick whichever of the three strategies performed best on each pair, based on out-of-sample Sharpe, before combining.
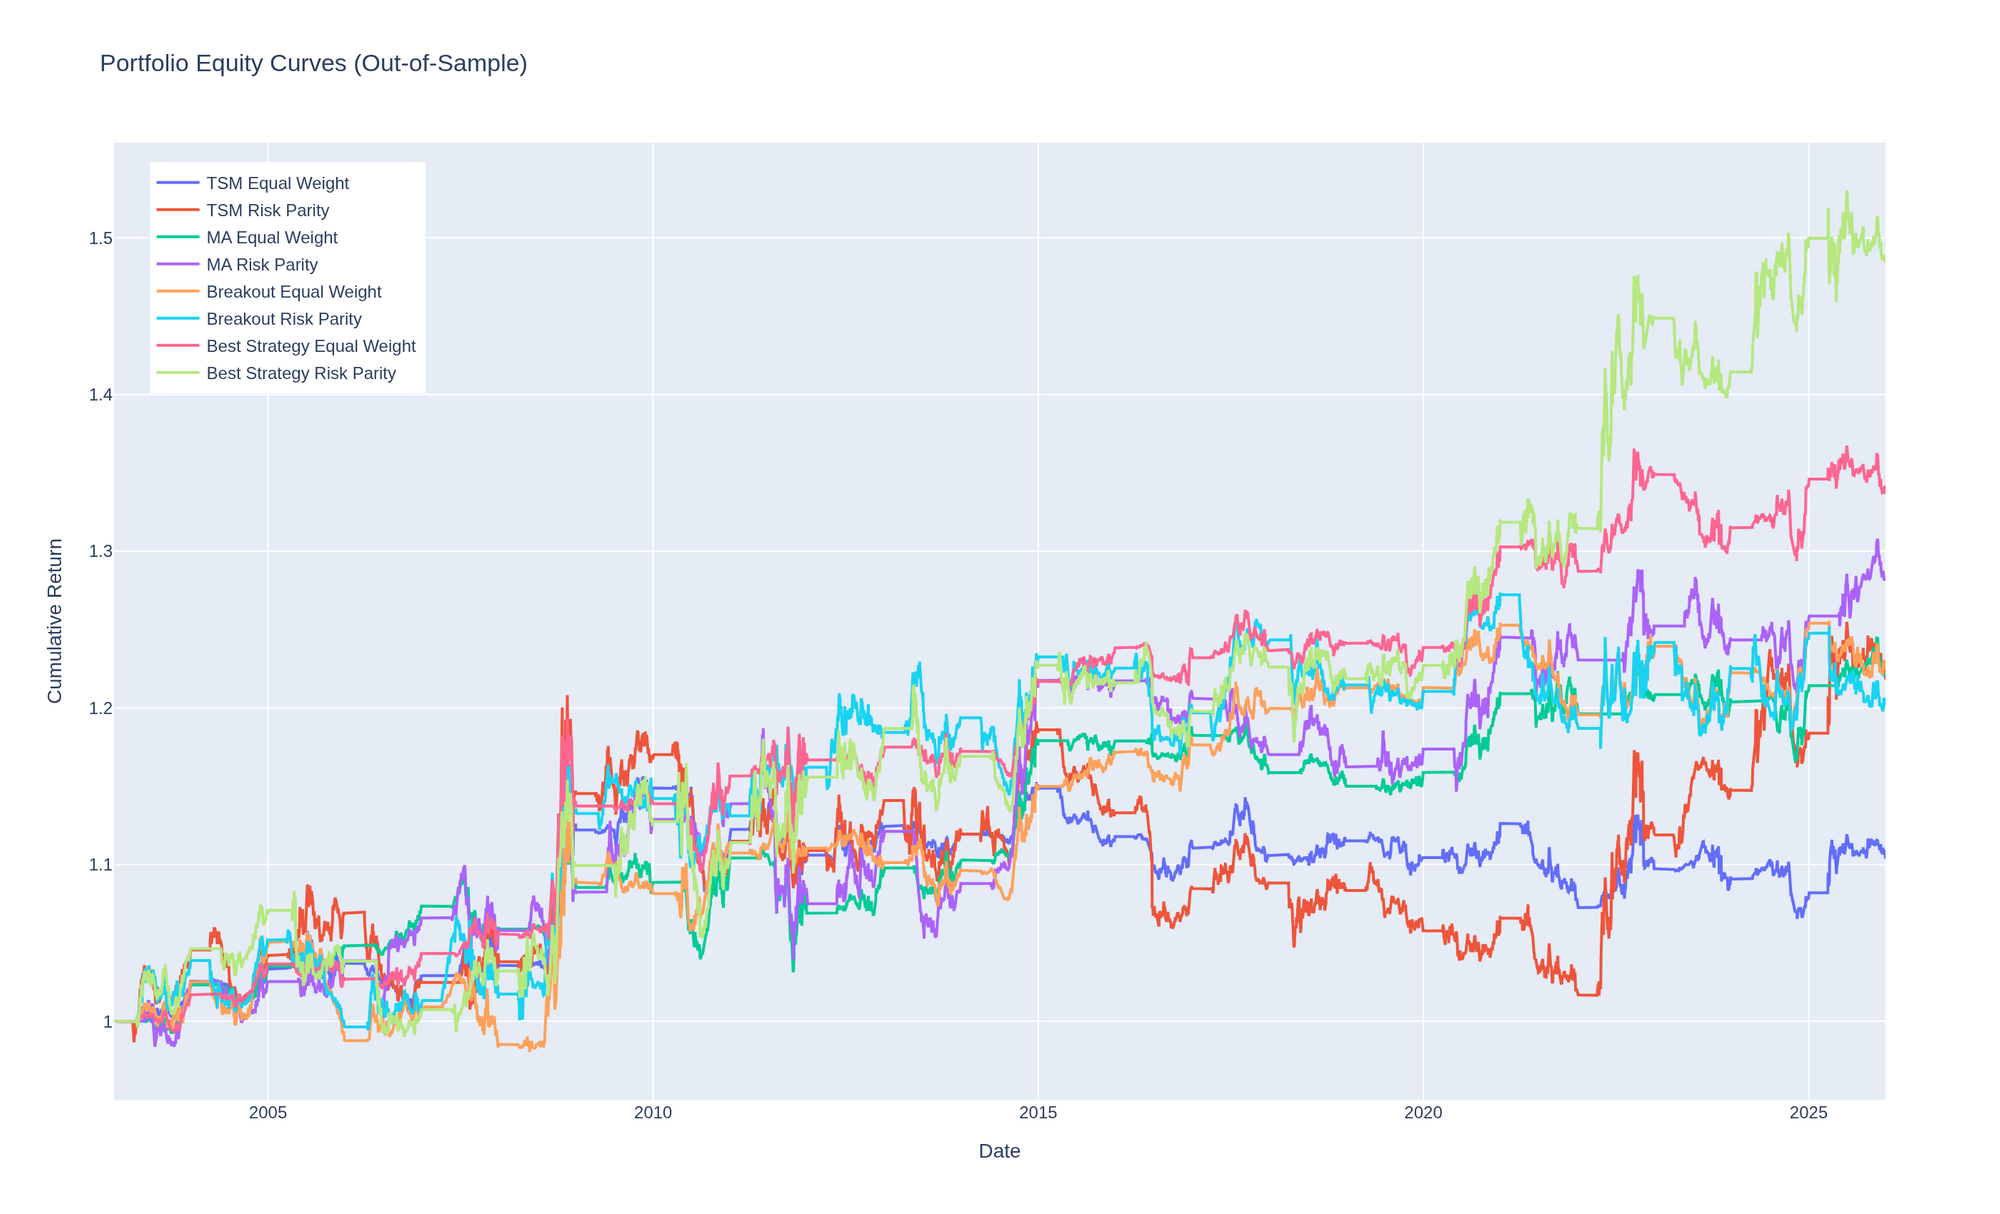
| Portfolio | CAGR | Sharpe | Sortino | Max DD | Calmar |
|---|---|---|---|---|---|
| Best Strategy EW | 1.24% | 0.43 | 0.46 | -8.25% | 0.15 |
| Best Strategy RP | 1.69% | 0.38 | 0.42 | -9.62% | 0.18 |
| MA Equal Weight | 0.85% | 0.33 | 0.34 | -8.07% | 0.11 |
| MA Risk Parity | 1.06% | 0.30 | 0.32 | -12.45% | 0.09 |
| Breakout Equal Weight | 0.86% | 0.26 | 0.29 | -7.24% | 0.12 |
| Breakout Risk Parity | 0.78% | 0.20 | 0.24 | -7.83% | 0.10 |
| TSM Risk Parity | 0.84% | 0.20 | 0.24 | -15.87% | 0.05 |
| TSM Equal Weight | 0.42% | 0.16 | 0.18 | -8.91% | 0.05 |
Best Strategy: Equal Weight has the highest risk-adjusted return, with a Sharpe ratio of 0.43, still short of the 0.5 portfolio tradeability bar. Risk parity underperforms equal weight on Sharpe (0.38 vs 0.43) but delivers a higher CAGR (1.69% vs 1.24%), a reminder that the two objectives, risk-adjusted consistency and raw growth, aren't always served by the same weighting scheme. Picking the best strategy per pair clearly adds value over committing to a single strategy across all seven, and TSM is the weakest at the portfolio level despite owning the two best individual pairs.
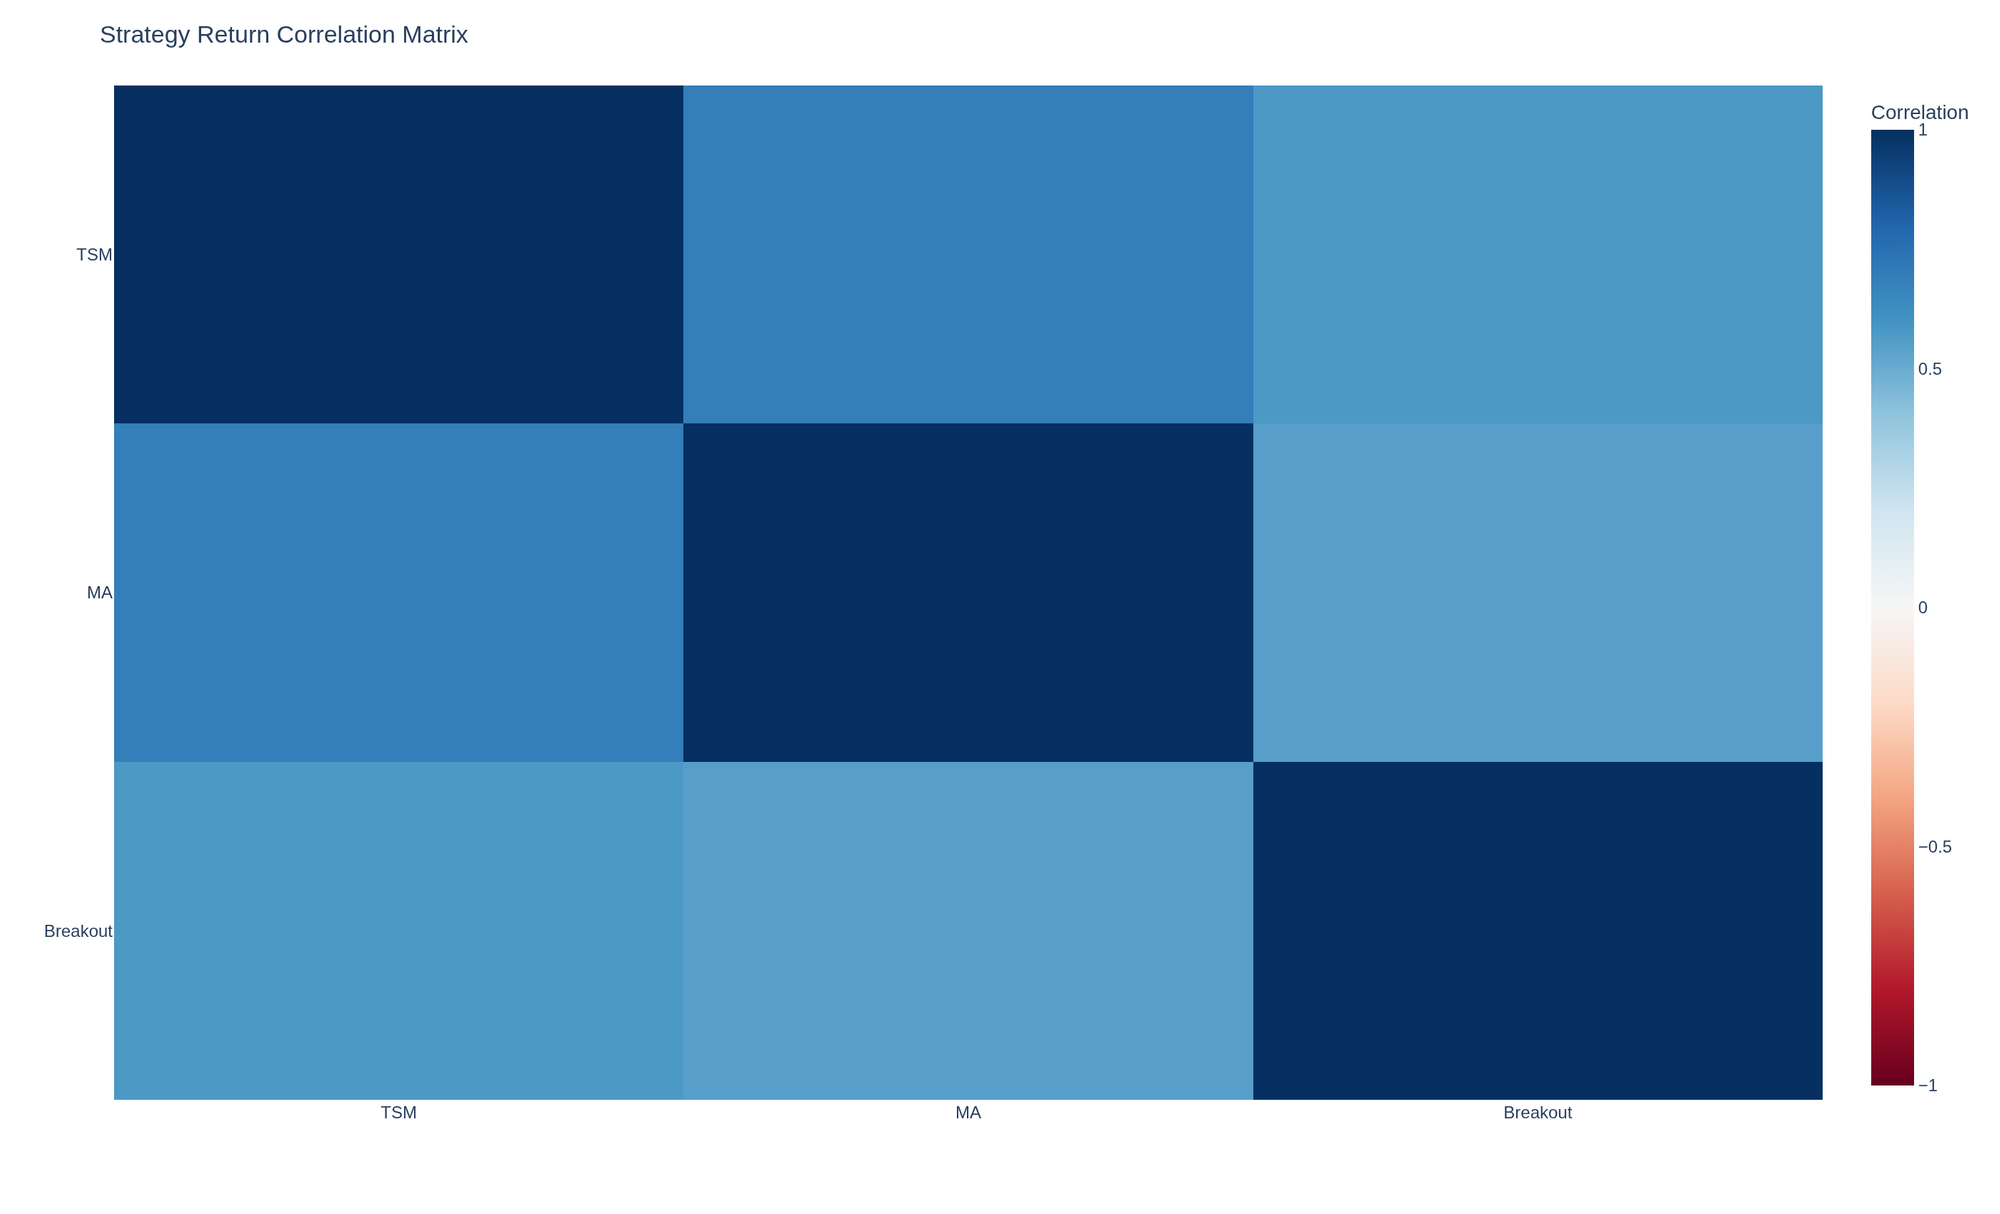
The three approaches are moderately to highly correlated (0.55 to 0.69), which means combining them provides less diversification than it might suggest on paper. All three trend-following styles are largely capturing the same underlying factor.
Crisis Alpha Analysis
Four historical crisis windows were defined to test whether trend-following delivers the "crisis alpha" it's often credited with in the futures literature.
| Crisis | Period | Duration |
|---|---|---|
| 2008 GFC | Oct 2007 - Mar 2009 | 17 months |
| 2011 Euro Debt | Jul-Dec 2011 | 6 months |
| 2020 COVID | Feb-Dec 2020 | 10 months |
| 2022 Rate Hike | Jan-Dec 2022 | 12 months |
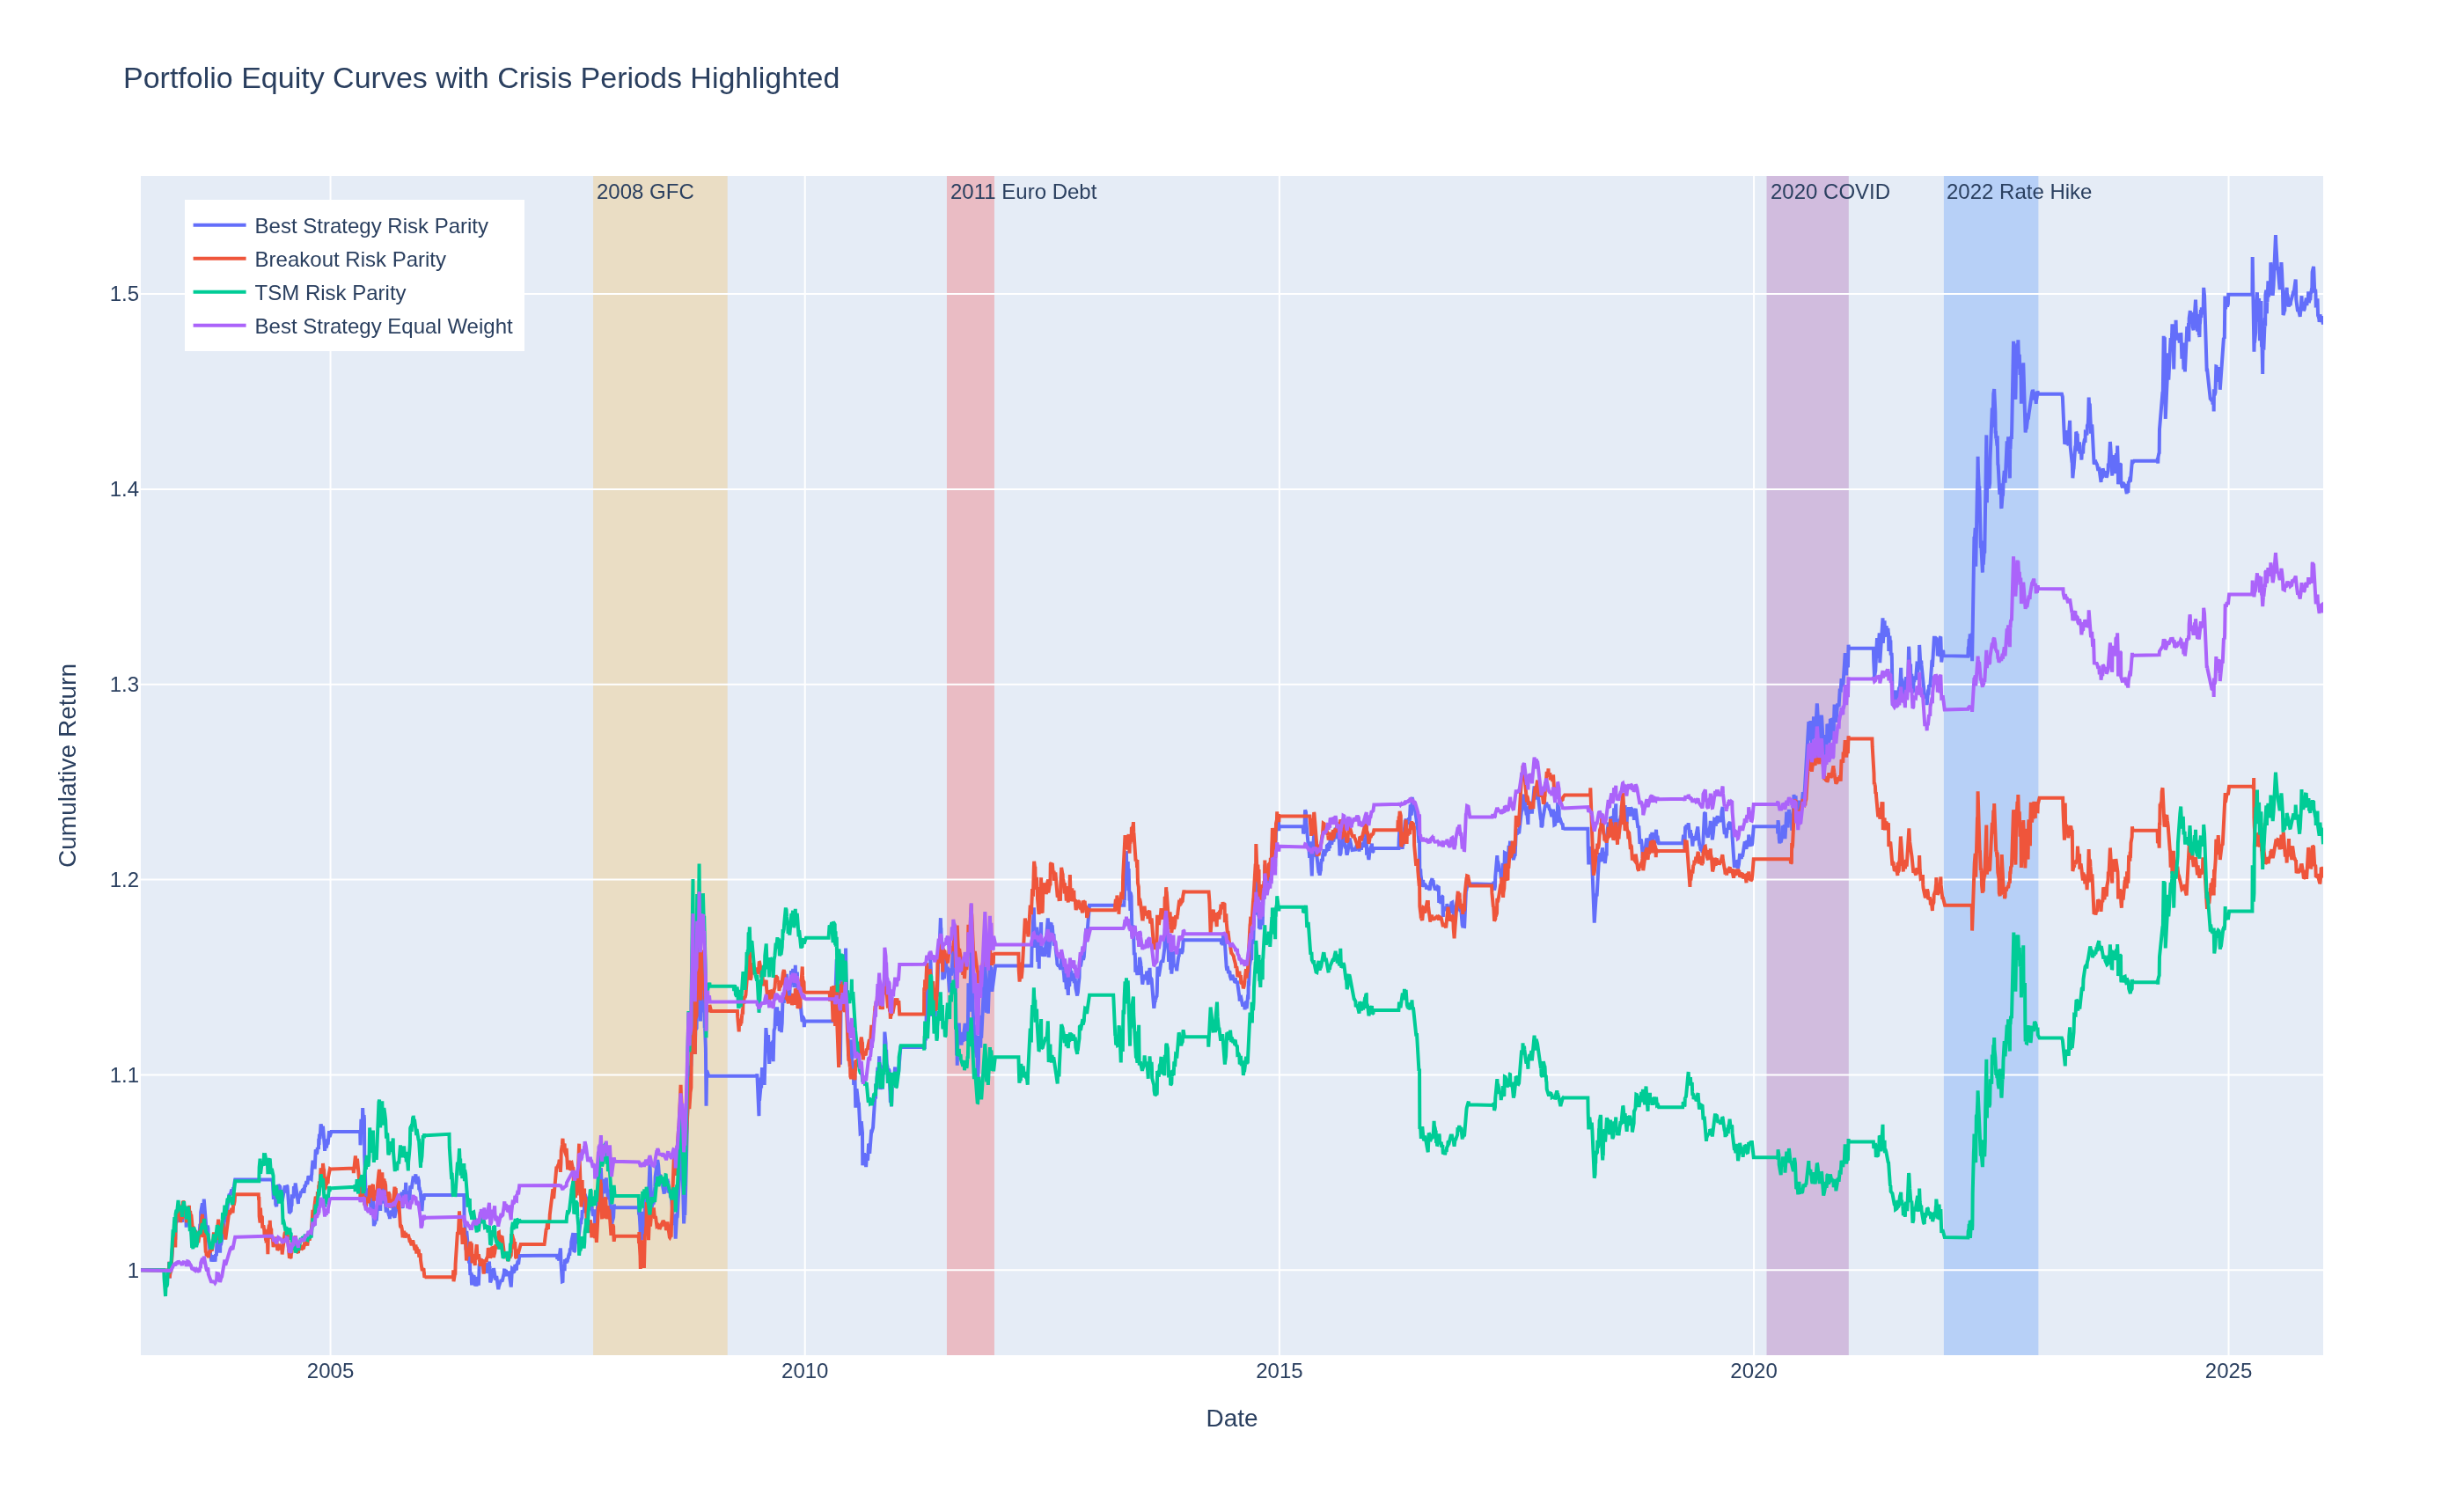
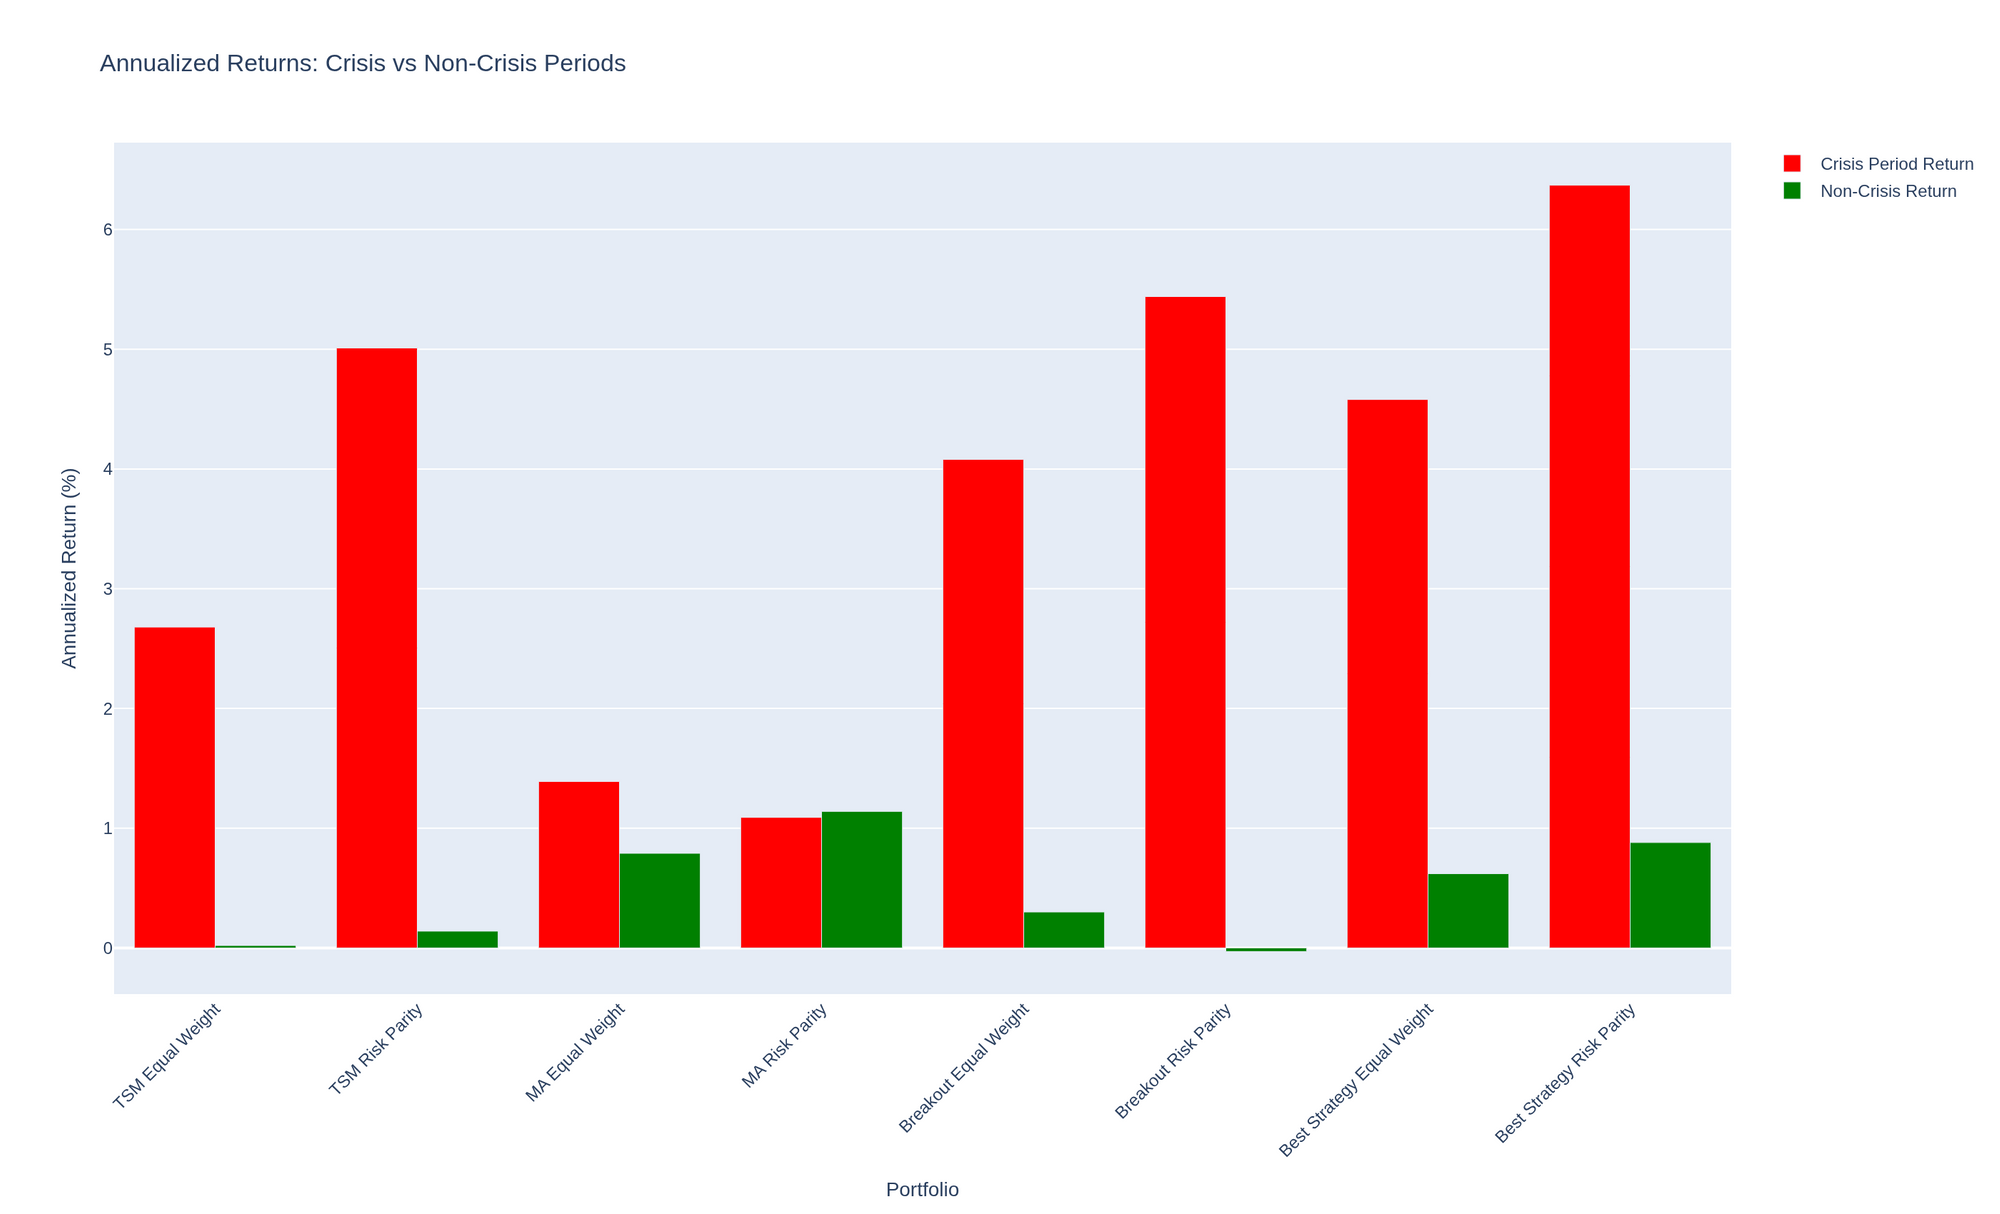
Best Strategy Risk Parity delivered the highest average crisis alpha at 6.20% across the four crises: +6.91% in the 2008 GFC, +7.44% during COVID, +10.20% during the 2022 rate-hike cycle, and a much more muted +0.26% during the 2011 Euro debt crisis. Risk parity weighting outperforms equal weighting for most strategy pairs, particularly during crises, even though it lags slightly on the full-sample Sharpe ratio. Statistical significance was confirmed for the COVID-19 period (p=0.039 for Best Strategy Risk Parity), but not consistently across the other three crises, several of which were directionally positive without reaching conventional significance.
Leverage Sensitivity
With a path-dependent leverage model, 3% annual financing cost plus liquidation risk at equity wipeout, the Sharpe ratio decreases as leverage increases. That's a meaningfully different result than the naive return-times-leverage approach, which keeps Sharpe flat by construction since both return and volatility scale together.
| Leverage | CAGR | Max DD | Sharpe | Calmar |
|---|---|---|---|---|
| 1x | 1.69% | -9.62% | 0.38 | 0.18 |
| 2x | 0.13% | -24.01% | 0.06 | 0.01 |
| 3x | -1.63% | -49.30% | -0.04 | -0.03 |
| 5x | -5.70% | -80.16% | -0.13 | -0.07 |
| 10x | -18.46% | -99.33% | -0.19 | -0.19 |
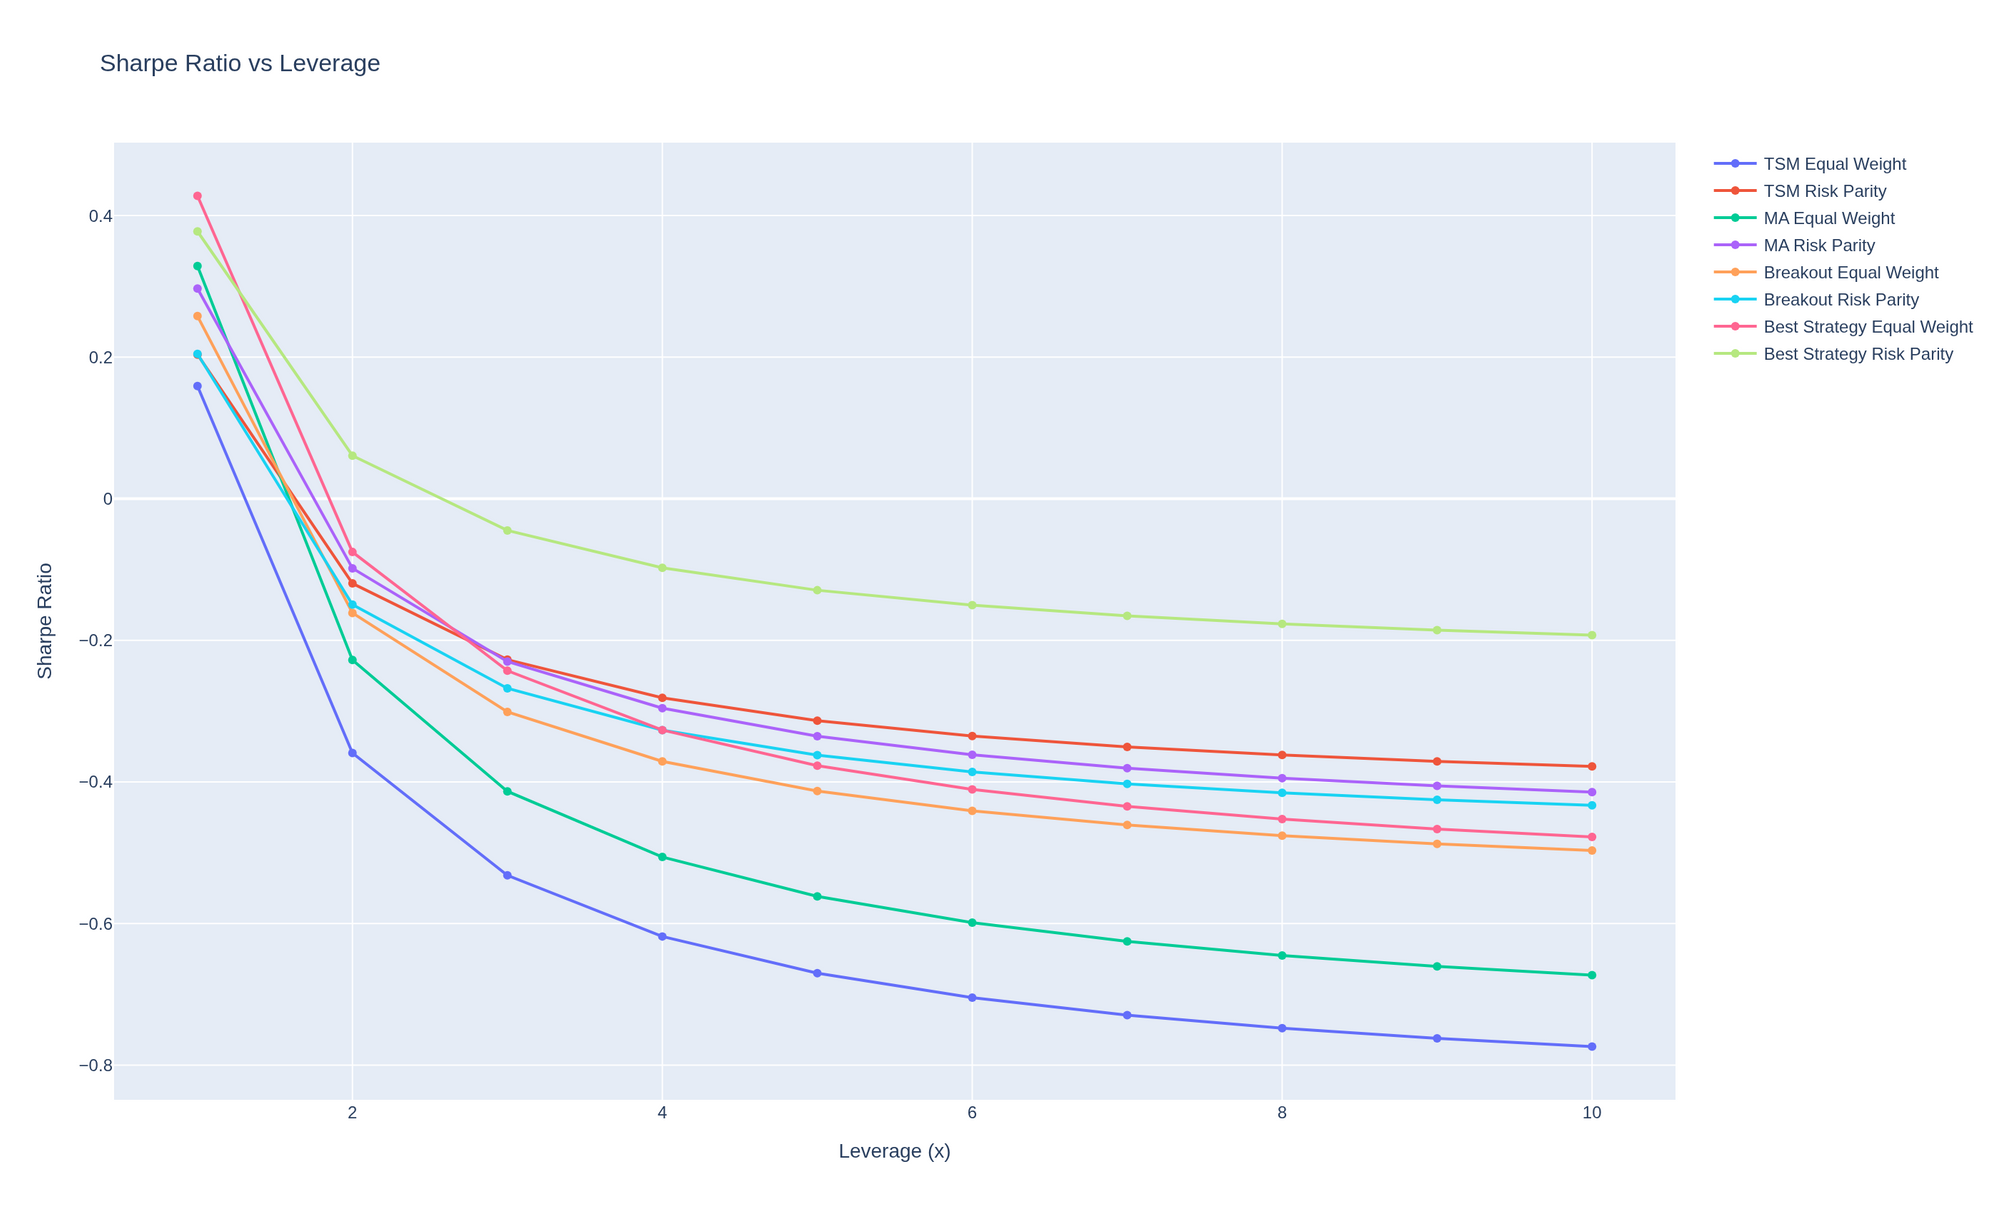
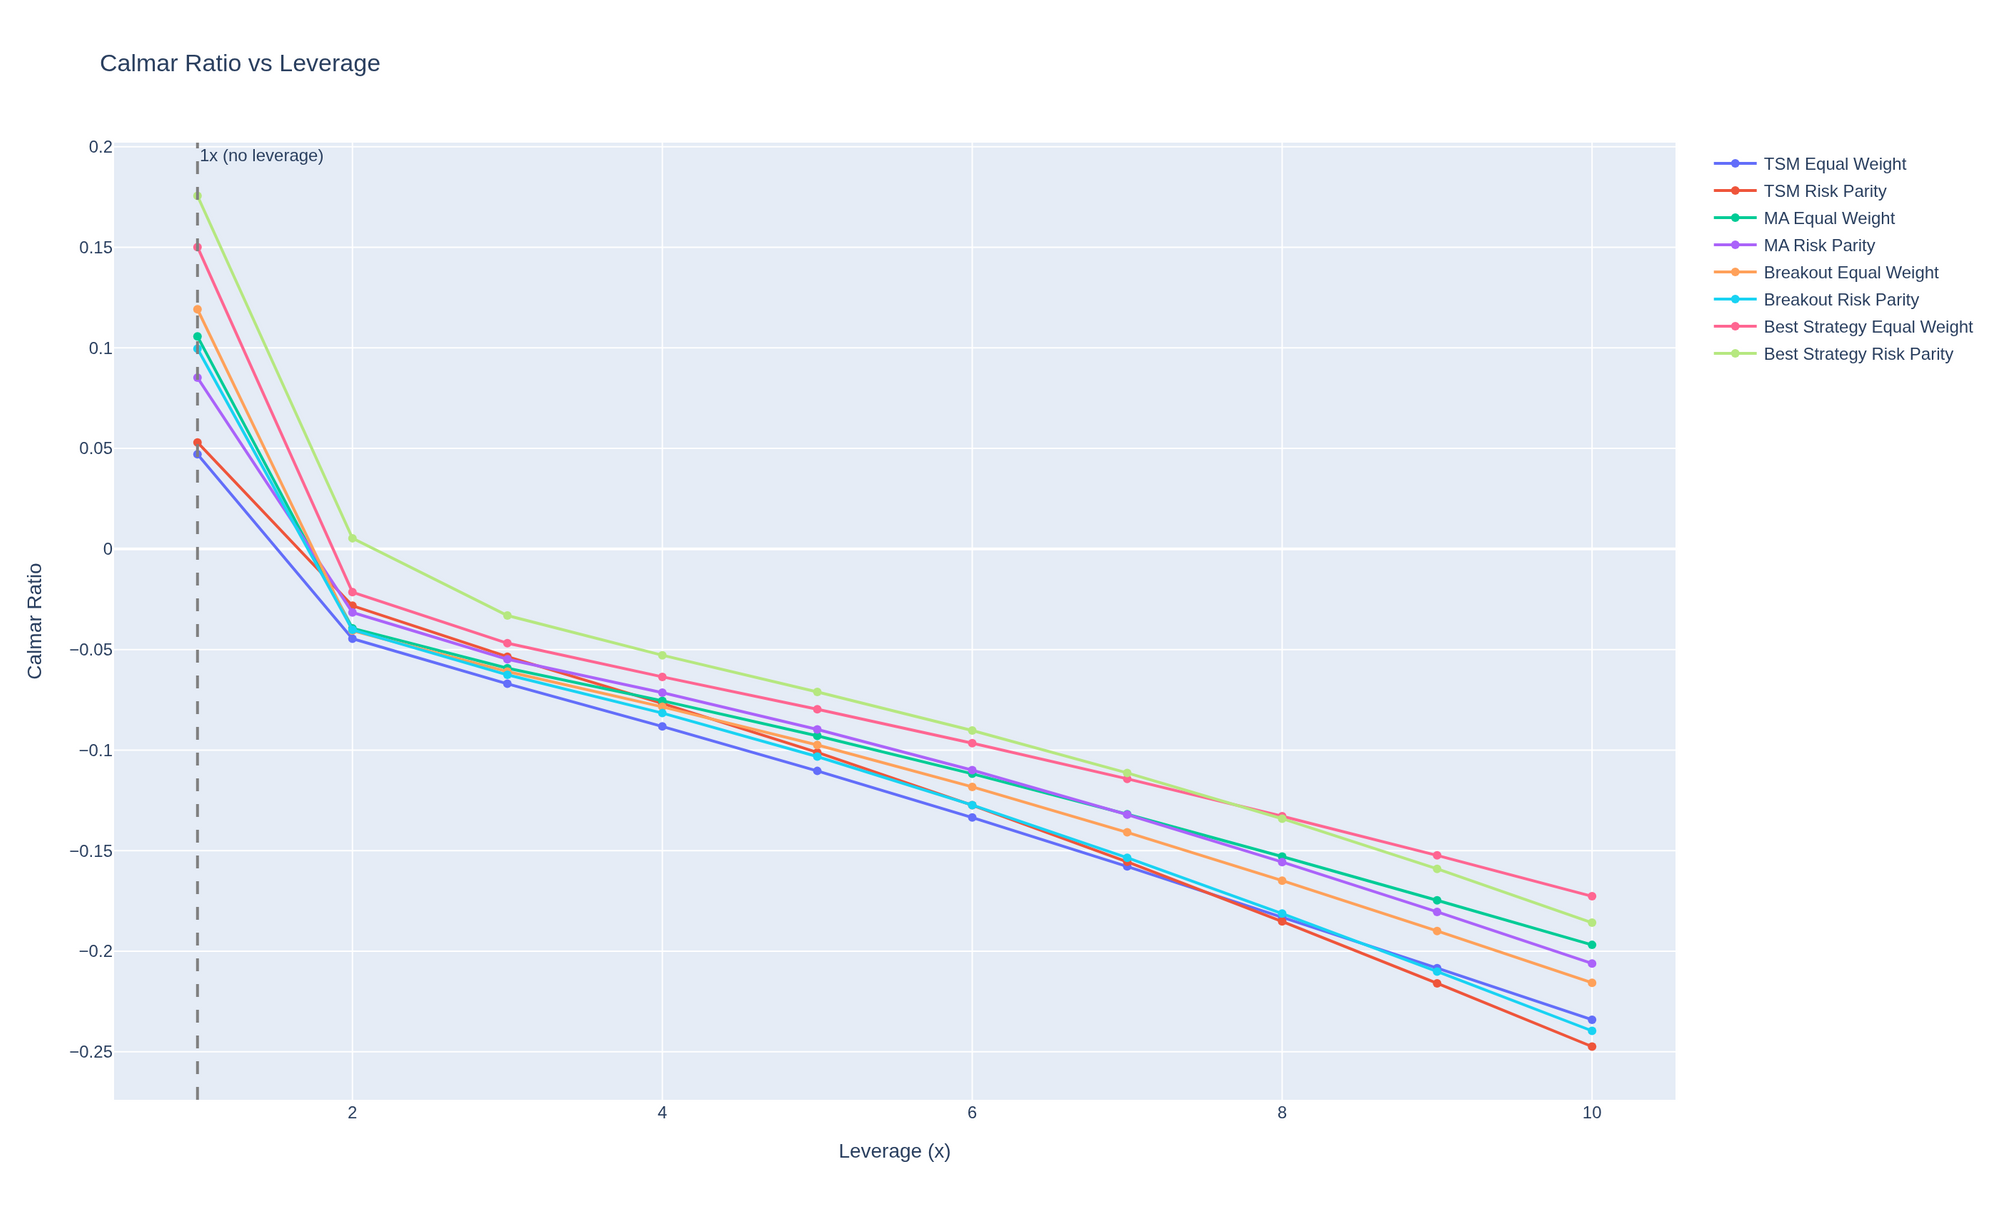
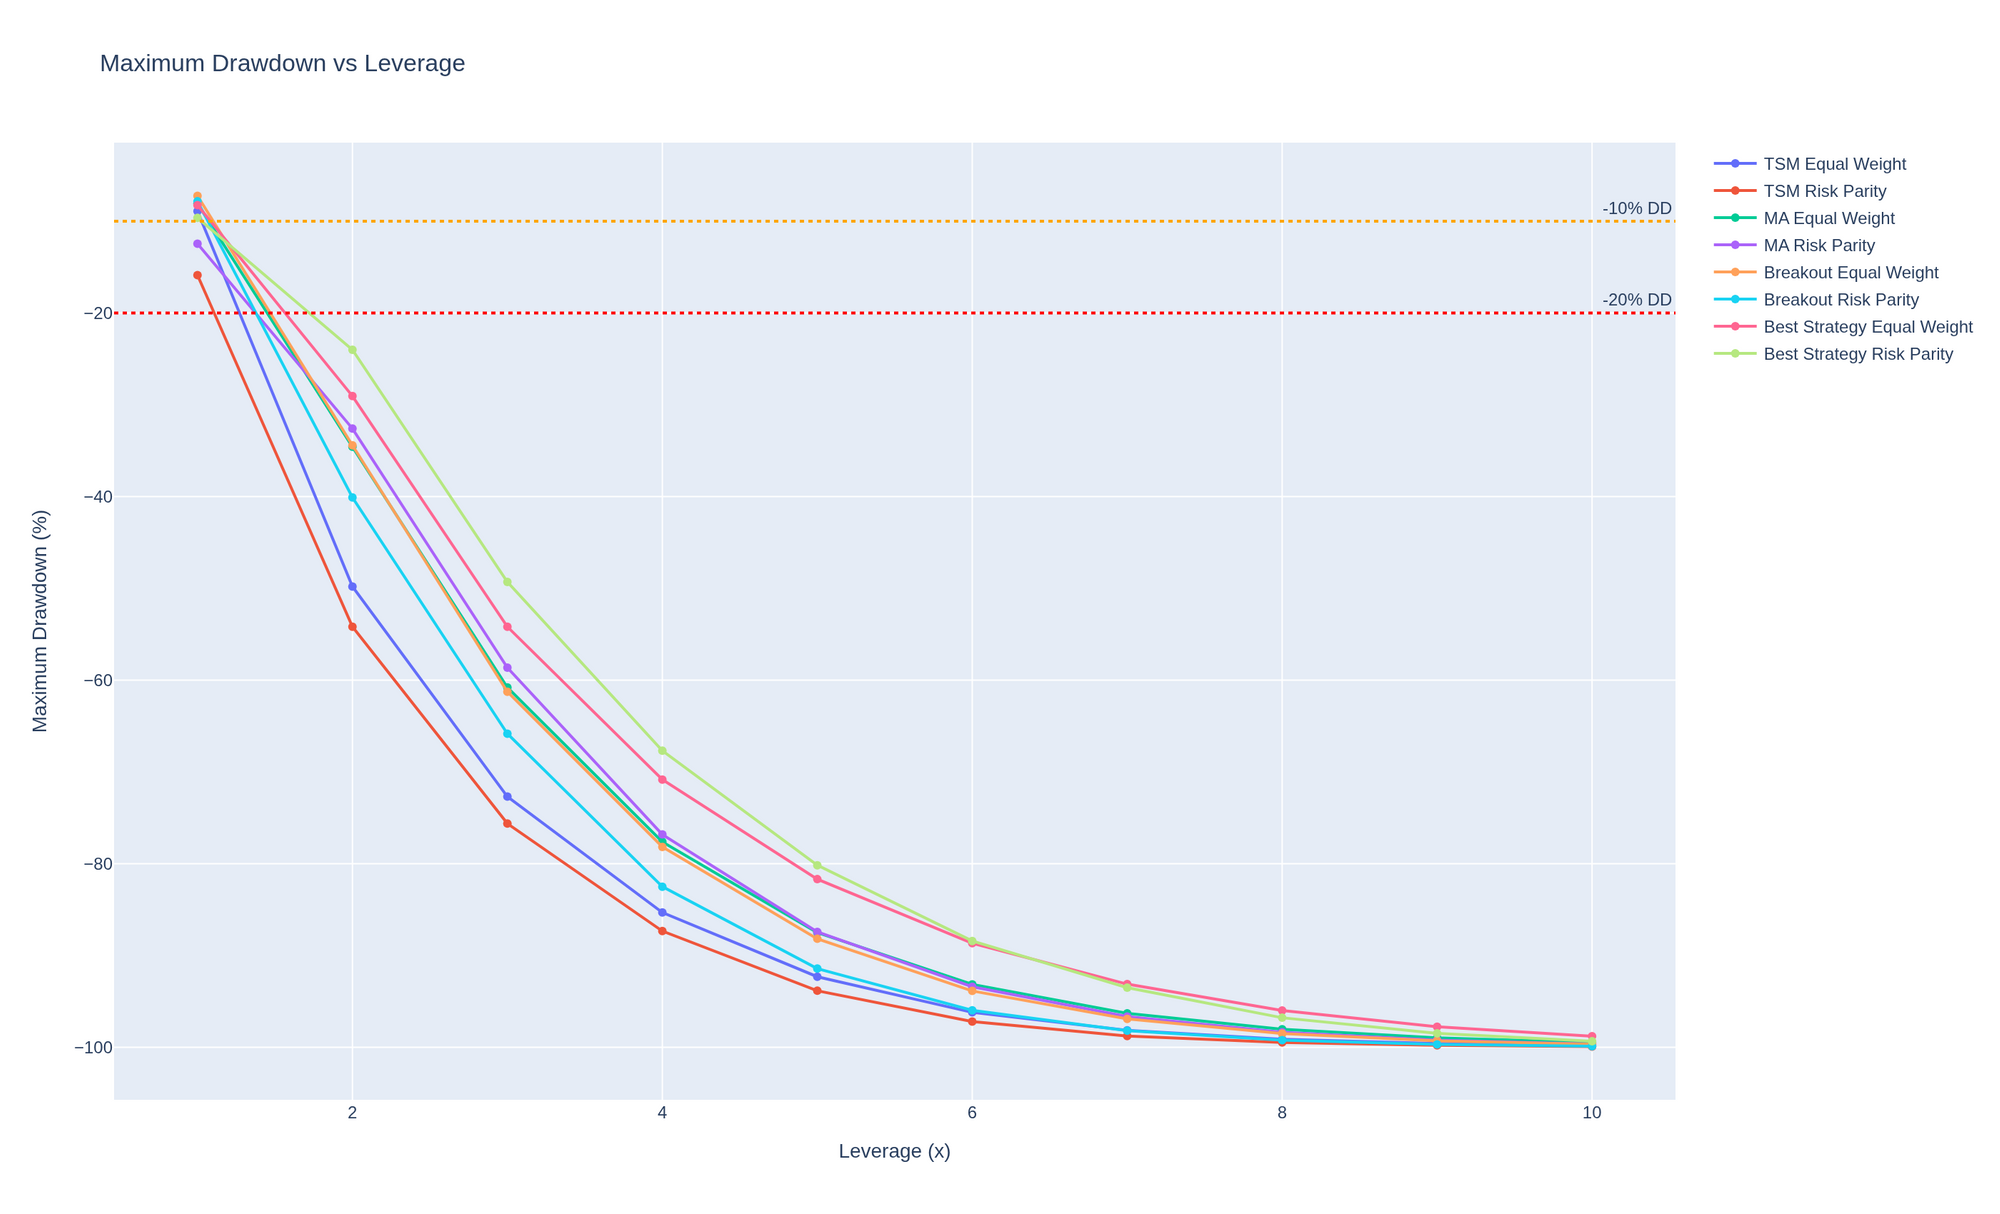
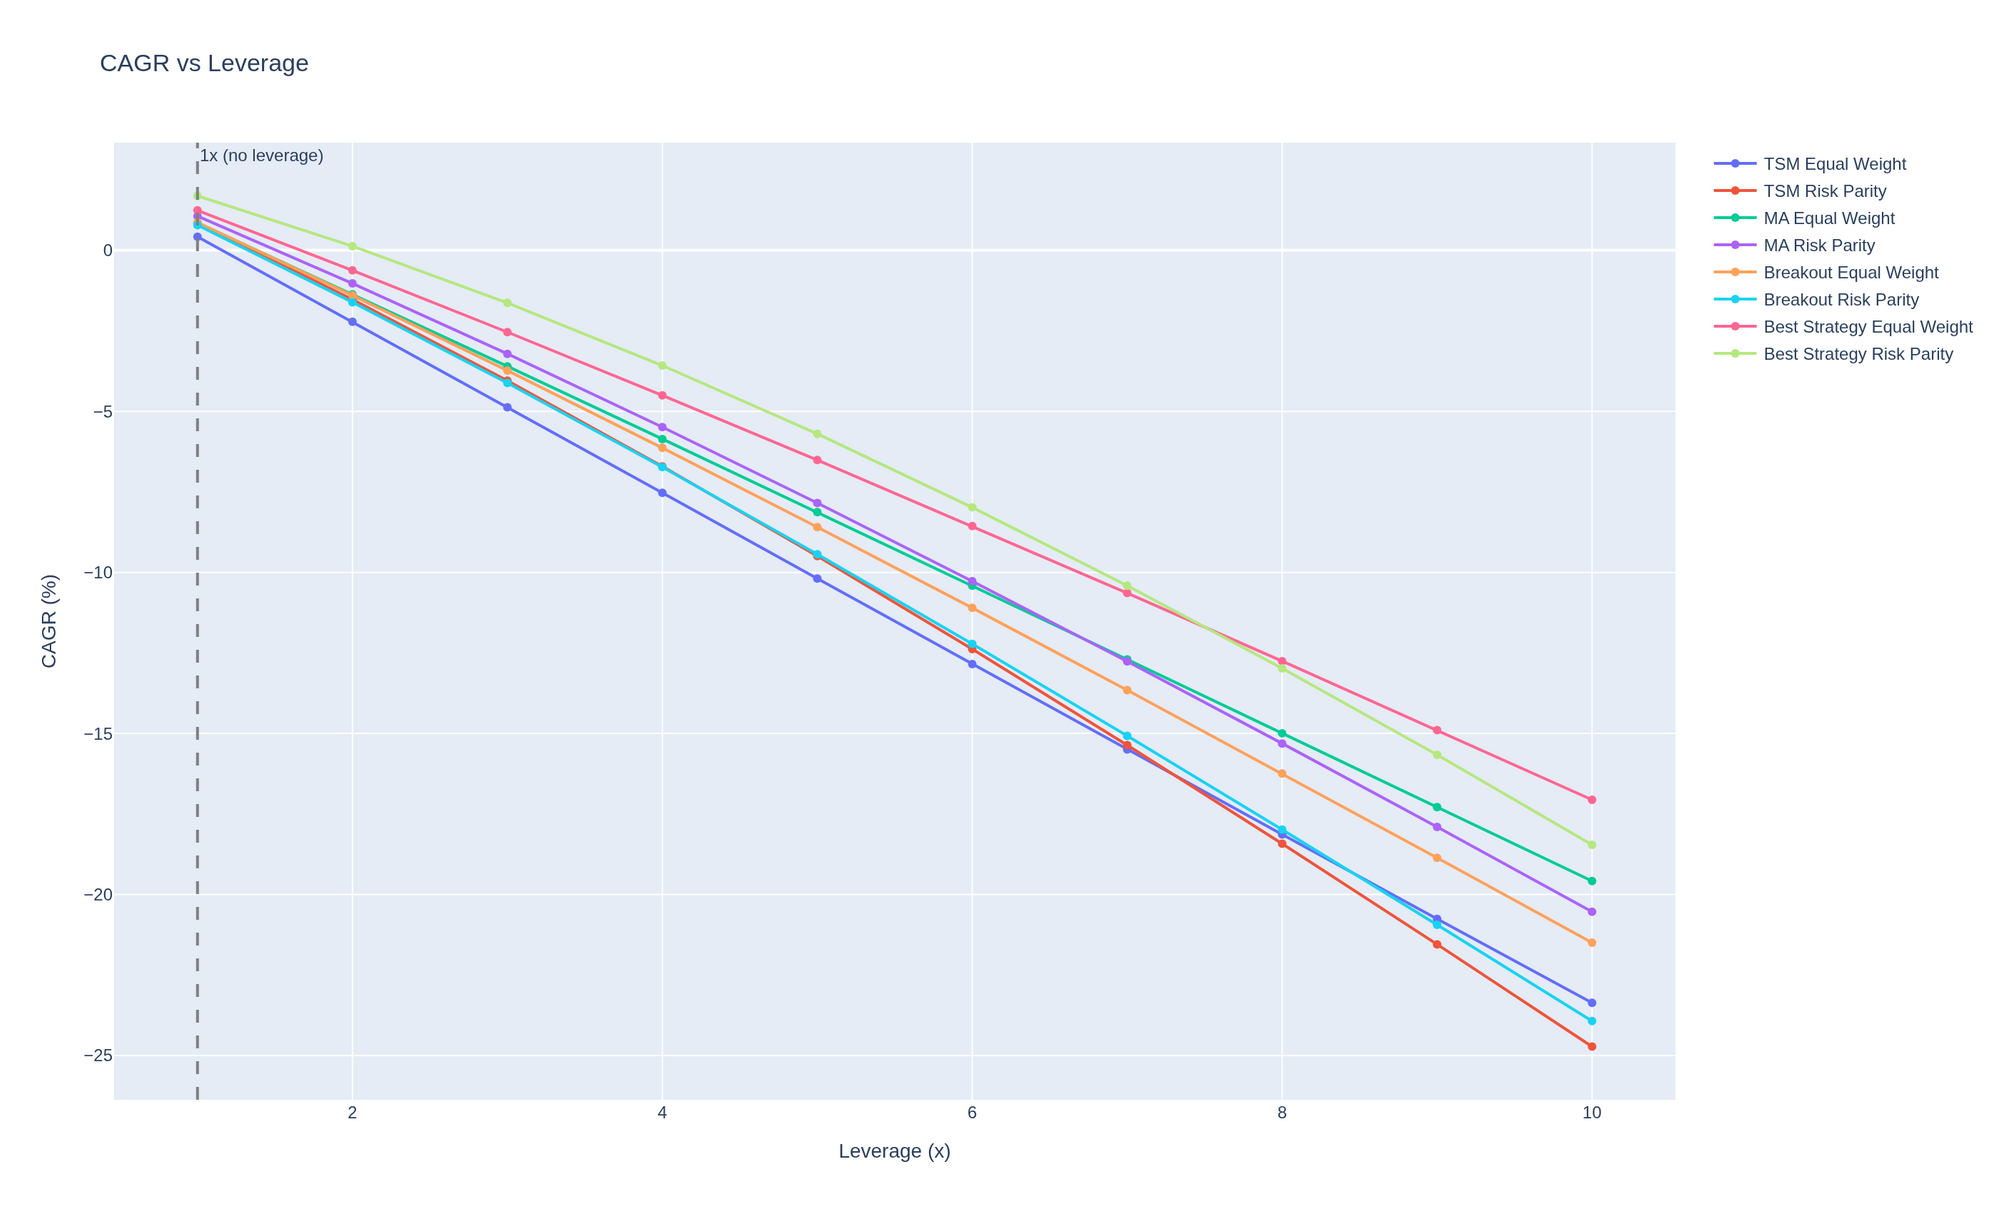
The degradation comes from two compounding effects: financing drag, borrowing at 3% per annum on (leverage - 1) times capital steadily reduces net returns, and compounding asymmetry, where larger drawdowns at higher leverage take disproportionately longer to recover from. Every single portfolio tested has the same optimal leverage: 1x. Since the unlevered Sharpe is already below the 0.5 tradeability bar, leverage never helps; it only adds cost.
Edge Diagnosis
Pulling the findings from every earlier notebook together, four diagnostic questions summarize where this strategy family's edge actually lives:
Is there any edge at all? Yes, but it's thin. Overall out-of-sample Sharpe across all combinations is 0.14, with all 7 pairs and all 3 strategies showing positive (if often marginal) returns. The best single pair-strategy combination is TSM on USDJPY at 0.78 Sharpe; the best portfolio is Best Strategy Equal Weight at 0.43.
Is the edge concentrated in a few regimes? Largely, yes. Tagging each day by the underlying pair's 252-day rolling return regime (Strong Down, Weak Down, Flat, Weak Up, Strong Up) shows 4 of 5 regimes are positive, with Flat markets the exception at a -0.06 Sharpe ratio. Strong Down is actually the best regime at 0.50 Sharpe, consistent with the crisis-alpha results above: these strategies work when markets are trending hard in either direction, and struggle when they're range-bound.
Does leverage destroy the edge through costs? No, more precisely, leverage destroys the edge, but base-level transaction and swap costs are manageable. The real cost problem only shows up once leverage is added, per the Leverage Sensitivity results above.
Is the edge diluted by poor portfolio construction? Partially. Strategy correlations of 0.55 to 0.69 limit the diversification benefit of combining TSM, MA, and Breakout. That said, the Best Strategy selection approach, picking whichever strategy performed best per pair, does outperform any single-strategy portfolio, so construction choices aren't the main bottleneck here.
Overall: a broad but thin edge. Positive across most pairs, strategies, and regimes, but not strong enough in aggregate to clear a standard tradeability bar outside of two specific pair-strategy combinations.
Discussion and Limitations
- Limited portfolio tradeability. The best portfolio Sharpe (0.43) falls short of the 0.5 threshold, and only two of seven individual pairs are tradeable on that same basis.
- Parameter stability approach. Neighborhood stability scoring guards against overfitting but may be overly conservative; alternative approaches, such as Bayesian model averaging, could yield different results.
- No transaction cost optimization. Fixed transaction costs were assumed throughout; real-world costs, including slippage and market impact, may vary significantly by pair and by trade size.
- No slippage modeling. The backtest assumes perfect execution at closing prices; live execution would incur additional costs not captured here.
- Interest rate data quality. Swap calculations depend on accurate central bank rate data from FRED; gaps or delays in that data could affect results.
- No live trading results. Everything here is historical. Live performance would likely be worse once implementation costs are factored in.
- Limited FX pairs. Only the seven major pairs were tested; emerging-market and exotic pairs, which often carry different trend and carry dynamics, were not included.
- Statistical significance. Crisis alpha was statistically significant only for the COVID-19 period. The other three crises were directionally positive but didn't reach conventional significance thresholds.
- High strategy correlation. A correlation of 0.55 to 0.69 between TSM, MA, and Breakout limits the real diversification benefit of running all three.
- Leverage model assumptions. The path-dependent leverage model assumes a 3% borrowing cost and immediate liquidation at equity wipeout; real-world margin requirements and financing terms vary by broker and regime.
Conclusion
After walk-forward validation with stable parameter selection across 23 years of out-of-sample data (2003-2025), the overall verdict is limited tradeability.
| Metric | Result | Threshold | Status |
|---|---|---|---|
| Best Portfolio Sharpe | 0.43 (Best Str. EW) | > 0.5 | FAIL |
| Tradeable Pairs | 2 of 7 | - | PARTIAL |
| Best Single Pair Sharpe | 0.78 (TSM USDJPY) | > 0.5 | PASS |
| Avg Crisis Alpha | 6.20% (Best Str. RP) | > 0% | PASS |
| Max Drawdown | -7.24% to -15.87% | < -20% | ACCEPTABLE |
Five insights stand out. First, TSM dominates among the pairs that do work: both tradeable pairs, USDJPY and EURUSD, use time-series momentum, confirming that momentum signals perform best on liquid, trending pairs. Second, selecting parameters for neighborhood stability rather than peak historical Sharpe reduced out-of-sample performance relative to a naive fit, which is itself informative: the raw, unvalidated results were partly a product of overfitting. Third, the 0.55 to 0.69 correlation among TSM, MA, and Breakout confirms that all three approaches largely capture the same trend factor, which caps the diversification benefit of running them together. Fourth, FX swap costs from interest rate differentials are a real drag, especially on carry-sensitive pairs like AUDUSD and NZDUSD. Fifth, leverage hurts rather than helps at every level tested, since financing costs and compounding asymmetry erode risk-adjusted returns faster than raw returns scale up.
None of that erases the project's most encouraging finding: a genuine, if not always statistically airtight, crisis-alpha effect. Best Strategy Risk Parity's 6.20% average return across four historical crises, with the COVID-19 result reaching statistical significance at p=0.039, is consistent with the broader crisis-alpha hypothesis from the trend-following literature, even in an asset class, spot FX, where the rest of the strategy's edge turned out to be thinner than the futures-market literature might suggest.
Frequently Asked Questions
Q1. What is the main objective of this project? The project tests whether trend-following strategies, time-series momentum, moving-average crossover, and channel breakout deliver robust, risk-adjusted performance on major spot FX pairs, using walk-forward validation rather than a single in-sample fit.
Q2. Why test FX spot markets specifically, rather than futures? Most of the published evidence for trend-following comes from futures markets, where returns embed roll yields and term premia. Spot FX has no futures curve to harvest carry from, so this project asks how much of that documented "trend premium" survives once the futures curve is gone.
Q3. What three strategies were compared, and how do they differ? Time-series momentum trades the sign of cumulative return over a lookback window. Moving-average crossover trades when a fast MA crosses a slow MA. Channel breakout trades when price breaks a rolling high/low channel. All three use volatility-targeted position sizing on top of the core signal.
Q4. How was walk-forward validation set up? 23 rolling windows of 3-year training and 1-year out-of-sample testing, stepped forward annually from 2003 to 2025. Parameters were chosen during training using neighborhood stability scoring, rather than re-selected from test-fold results, thereby avoiding look-ahead bias.
Q5. Which pairs and strategies were actually tradeable? Only two of seven: time-series momentum on USDJPY (0.78 Sharpe) and on EURUSD (0.54 Sharpe), both clearing the 0.5 tradeability threshold. The other five pairs were positive but below that bar.
Q6. Why did portfolio-level performance fall short of the best single-pair results? Combining all seven pairs dilutes the two strong TSM pairs with five weaker ones. Even the best portfolio construction, picking each pair's best strategy and equal-weighting the results, landed at a 0.43 Sharpe, just under the 0.5 bar that USDJPY and EURUSD individually clear.
Q7. What happened during crisis periods such as 2008 and COVID-19? The strategies delivered positive crisis alpha in three of the four crises tested: +6.91% in the 2008 GFC, +7.44% during COVID, and +10.20% during the 2022 rate-hike cycle for the best-performing portfolio. The 2011 Euro debt crisis was mixed. Only the COVID result reached conventional statistical significance.
Q8. Why does leverage hurt rather than help here? A realistic, path-dependent leverage model with 3% annual financing costs and liquidation risk shows Sharpe declining at every leverage level above 1x. Financing drag and the fact that larger drawdowns compound harder both work against the strategy as leverage rises, since the base Sharpe was already below the tradeability threshold to begin with.
Q9. What is neighborhood stability scoring, and why does it matter here? Instead of selecting the parameter combination with the single best historical Sharpe ratio, the project ranks parameters by how consistently well neighboring parameter values also perform. This reduces the risk of picking a single lucky combination, and the resulting out-of-sample numbers are noticeably more conservative than a naive best-Sharpe fit would have produced.
Q10. What are the main limitations and future directions? The main limitations are the absence of transaction cost optimization, slippage modeling, and live trading validation, as well as a strategy universe limited to seven major pairs and a high correlation among the three trend-following styles tested. Future work could expand to emerging-market and exotic pairs, test alternative parameter-selection methods such as Bayesian model averaging, and validate the findings through live or paper trading.
Next Steps
If you'd like to go deeper into trend-following and walk-forward validation, here are concise resources to guide your build:
Start with the foundations in Momentum Trading: Types, Strategies, and More, then see how time-series momentum has been applied in a similar EPAT project in Trend-Following Strategy in Futures Using Time Series Momentum and Continuous Forecasts.
For the other two signal methodologies used here, read Donchian Channels: How to Turn a Simple Idea Into Working Strategies for channel breakout logic, and explore portfolio weighting choices in Risk Parity Portfolio: Strategy, Example and Python Implementation.
For the validation methodology this project leans on throughout, read Walk-Forward Optimization: How It Works, Its Limitations, and Backtesting Implementation. Browse Algorithmic Trading Projects to shortlist your next build.
For a structured, hands-on learning path, explore Quantra's courses on momentum and portfolio construction.
Looking for a structured, hands-on path guided by expert practitioners?
EPAT offers a practitioner-led curriculum in Python-based algorithmic trading. You'll learn core strategies you can adapt to higher-frequency settings, work with broker APIs such as Alpaca, and build mentored live projects. Learn more or register here for our Executive Programme in Algorithmic Trading (EPAT).
Schedule an EPAT counselling call
To understand if EPAT is the right choice for you, talk to one of our specialists who have counselled thousands of learners over the past decade and helped them make the right career decision.