

Here's a rule that sounds sensible. Whenever the S&P 500 ETF (SPY) falls more than 1% in a day, buy it at (or just before) the close and sell at the next day's close, on the idea that sharp one-day drops tend to partly bounce back. From 2006 to September 2026 it made about 4.8% a year before costs, with a Sharpe ratio of 0.47 (annual return divided by volatility). That's less than simply holding SPY, which returned about 11% a year, because the rule sits in cash seven days out of eight. Still, it's positive, and it's a rule you can write in four lines. (It does assume you can trade at the very close that triggered it. Wait for the next day's close instead and the gross return drops to about 3.1% a year.)
Now charge it 10 basis points (0.1%) each time it buys or sells. Over the same twenty years it loses money, about -0.4% a year, and its Sharpe ratio falls to 0.02.
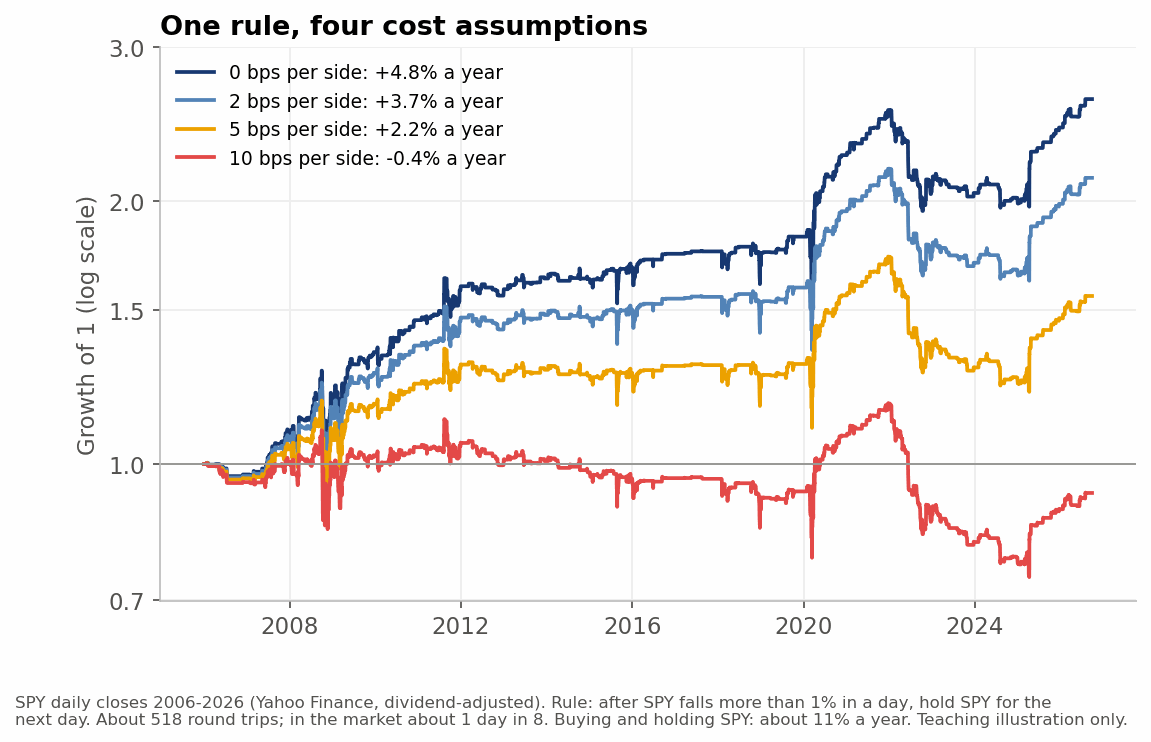
Nothing about the rule changed. Only the assumed cost did. SPY itself is one of the cheapest things in the world to trade, and at 1 or 2 basis points per side the rule still made about 4.2% and 3.7% a year. But 10 basis points is roughly what an Indian delivery trade pays in taxes and fees alone (about 11 per side), before any spread, so put the same rule on an Indian stock and the arithmetic starts to look like the red line. It's one of the most common reasons a strategy that shines in a backtest disappoints live, and it's among the least glamorous (nobody posts screenshots of their contract notes). So it's worth understanding precisely.
The short answer
Transaction costs cut returns by roughly the cost of one round trip multiplied by the number of round trips a year, so strategies that trade often suffer most. A strategy that trades a few times a year barely notices them, while one that trades daily can have its whole edge erased by a few basis points. The costs themselves are brokerage, taxes and exchange fees, the bid-ask spread, and slippage (the gap between the price you expected and the price you got). Backtest with realistic costs, measure your real costs once live, and prefer strategies whose average profit per trade is several times their cost per trade.
What counts as a transaction cost?
Every cost of getting in and out of a trade. They split into explicit costs printed on your contract note (brokerage, STT, exchange and SEBI fees, stamp duty and GST) and implicit costs that aren't billed but still bite: the bid-ask spread, slippage, and the market impact of your own order:
Explicit costs are the ones on the contract note. In India these are brokerage, securities transaction tax (STT), exchange transaction charges, the SEBI turnover fee, stamp duty and GST. In the US, most stock brokers charge no commission, but small regulatory fees still apply on sales.
The bid-ask spread is the gap between the best price someone will pay and the best price someone will sell at. If you buy with a market order and later sell with one, you pay the whole spread across the round trip. On very liquid instruments it's tiny, but on a thinly traded small-cap stock or a far-from-the-money option it can be larger than all the explicit charges put together.
Slippage and market impact are the difference between the price when your signal fired and the price you actually got. Part of it is latency (the price moved while your order travelled), and part is your own order moving the price, which matters more as trade size grows. Researchers have found this impact grows roughly with the square root of your order size relative to daily volume (Tóth and co-authors, 2011), so doubling your size raises the cost per share by about 40% (and the total cost of the order nearly threefold). For most retail sizes impact is small, and the spread and fees dominate.
What does a trade cost in India?
Indian explicit costs are higher than many people expect, mainly because of STT, and they've been rising. In Budget 2026-27, STT on futures went from 0.02% to 0.05% of the sell value, and on options from 0.1% to 0.15% of the premium, both effective 1 April 2026. That puts futures STT at roughly four times its level before October 2024.
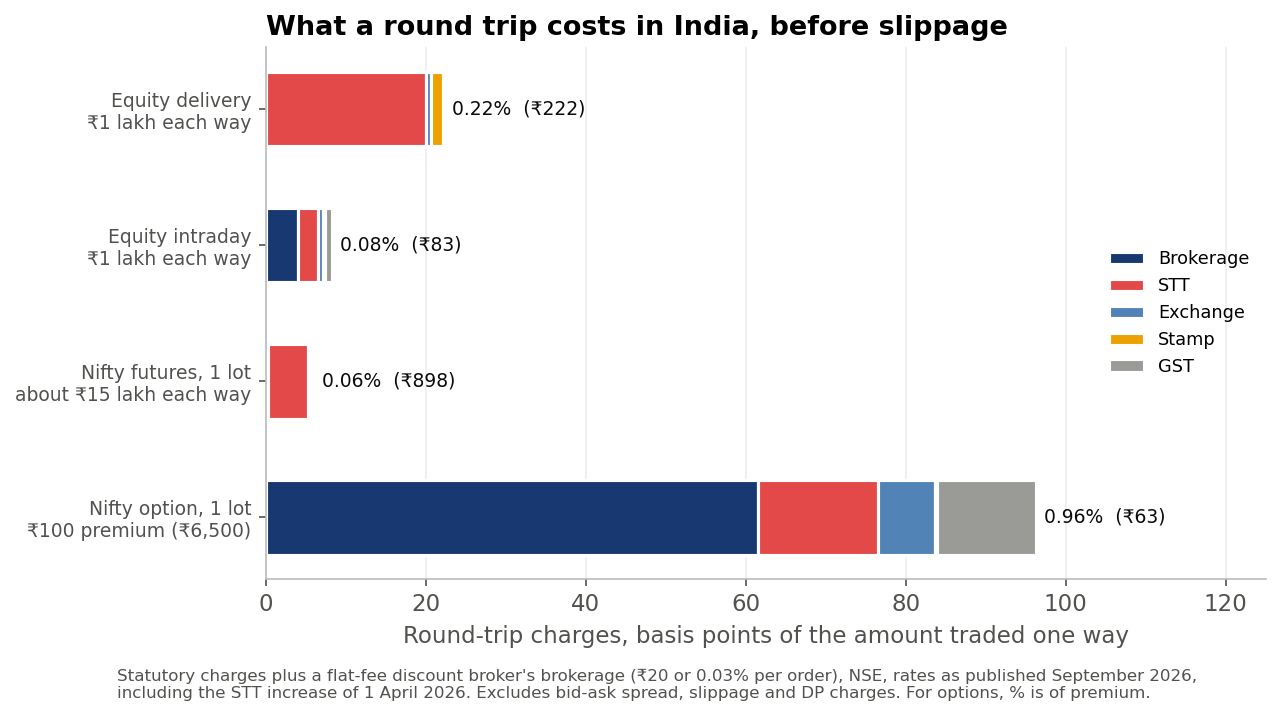
Working through a flat-fee discount broker's schedule (₹20 or 0.03% per order, whichever is lower), a round trip costs about:
- 0.08% (8 basis points) for ₹1 lakh of intraday equity, where brokerage is the largest part, followed by STT.
- 0.22% (22 basis points) for ₹1 lakh of equity delivery, almost all of it STT at 0.1% on each side.
- 0.06% (6 basis points) for one Nifty futures lot (about ₹15 lakh), almost all of it STT.
- About 1% (96 basis points) of the premium for one Nifty option lot at a ₹100 premium, because the flat ₹40 of brokerage is large next to a ₹6,500 premium. At larger premiums this falls sharply.
Two more charges catch bots out. Delivery sales usually carry a flat depository charge per stock sold, which matters on small trades. And an option bought and left to expire in the money attracts STT of 0.15% on its intrinsic value, which can be far larger than the STT on the premium, so many option-buying bots square off before expiry.
Take intraday equity. If a strategy makes an average of 0.15% per trade before costs, the explicit charges alone take more than half of it, and the spread hasn't been paid yet. SEBI's study of intraday traders (released July 2024, on FY23 data) found that loss-making traders spent an extra 57% of their trading losses on transaction costs. Costs didn't cause those losses, but they made every one of them deeper.
Why does trading frequency matter so much?
A fast rule pays for many more round trips, and each one is chasing a smaller move. A slow strategy making three round trips a year pays three sets of costs. A fast one making thirty pays ten times as much, and its profit per trade is usually smaller.
We can see this on the Nifty. Take four versions of the same simple momentum rule: hold the index when its return over the last N days is positive, and stay out otherwise, with N set to 3, 20, 100 or 200 days. Then charge each of them costs from zero to 30 basis points per side.
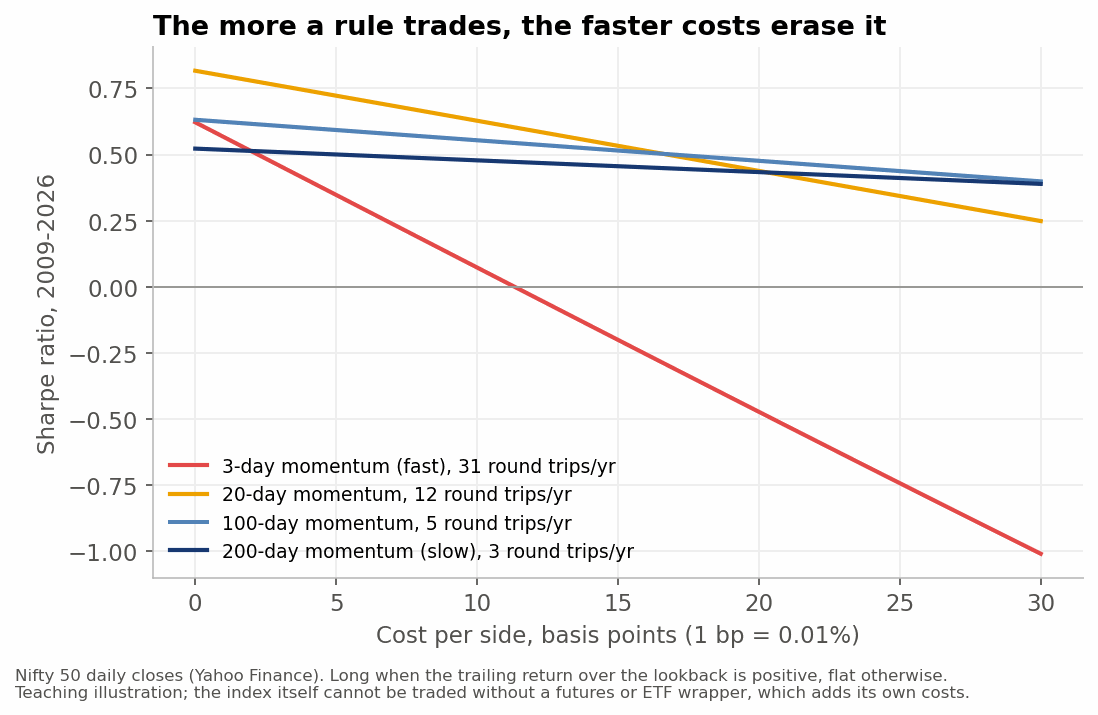
From 2009 to September 2026, with no costs, the 20-day rule looks best (a Sharpe ratio of 0.82), and the 3-day rule is respectable at 0.62, level with the 100-day rule. But the 3-day rule makes about 31 round trips a year, and its Sharpe ratio hits zero at around 11 basis points per side, well within realistic costs. The 200-day rule trades about three times a year, and at 20 basis points per side it still has a Sharpe ratio of 0.43, barely down from 0.52. At zero cost the order from best to worst was the 20-day, 100-day, 3-day and 200-day rules. At 20 basis points it's 100-day, 20-day, 200-day and 3-day, with the fast rule now deep in negative territory. So costs also change which strategy comes out best.
One caveat on our test: the Nifty index can't be traded directly, so a real version would go through futures or an ETF, with roll costs or tracking error on top. The ranking would survive that, but every line would shift down. (There's a subtler catch as well. NSE's official closing price is an average of the last half hour's trades, so a backtest that "trades at the close" uses a price nobody traded at exactly.)
Academic work finds the same pattern at scale. Novy-Marx and Velikov (2016) tested a broad set of published stock-market anomalies after trading costs. Most of those with one-sided monthly turnover below 50% still produced statistically significant returns after costs, at least when designed to keep costs down. Few of those with higher turnover did.
How should I put costs into a backtest?
Model them explicitly and err high. Charge every trade a realistic round-trip cost, add more slippage than you expect, never assume you trade at the touch, and test how the result changes if costs double. Being pessimistic and specific is what stops a backtest flattering a strategy that can't pay its way. A few habits cover most of it:
Model every explicit charge. Use your broker's actual schedule, including STT and stamp duty, rather than a round "0.05%". Rates change, and the 2024 and 2026 STT changes each altered the arithmetic for derivatives strategies.
Add half the spread per side if you use market orders. A backtest run on closing prices assumes you traded at the last price, which is usually at or near the midpoint of the spread. In reality you buy at the ask and sell at the bid. Ernie Chan gave a sharp example on his blog in 2015. A daily pairs strategy on two oil ETFs showed a Sharpe ratio of about 1 after deducting 5 basis points per side. Re-running it on actual bid and ask quotes wrecked the equity curve, because the flat cost had hidden a wide spread.
Add slippage for signals that fire on fast moves. If a strategy buys breakouts, the price tends to move against it in the very seconds its order is travelling. Start with a few basis points and measure.
Test a range of costs. Plot performance against cost per side, as in the chart above. If the strategy only works below 3 basis points and your realistic cost is 8, you've learned something valuable for free.
Compare the profit per trade with the cost per trade. This is the quickest sanity check there is. If your average trade makes 0.12% gross and costs 0.10% round trip, the margin is very thin, and any error in the cost estimate (or any drift in the edge) flips it negative. A comfortable ratio is several times, not one and a bit.
How do I measure costs once I'm live?
Record the price at the moment each signal fires, and the actual fill price. The difference, averaged over trades, is your real slippage. Compare it with what the backtest assumed. It's one of the most useful numbers to track (our article on monitoring trading bots explains how), because if live slippage runs at double the assumption, the live results will fall short of the backtest by a predictable amount.
For context, Frazzini, Israel and Moskowitz (2018) studied $1.7 trillion of real trades by one large institutional manager across 21 developed markets. They found an average implementation shortfall (total cost relative to the price when the decision was made) of about 11 basis points. That's a sophisticated manager with algorithmic execution, not a retail benchmark, but it's a useful reminder that even professionals pay around 10 basis points.
How can I reduce transaction costs?
Mostly by trading less, not by hunting a cheaper broker. Fewer round trips, longer holds, patient limit orders instead of chasing the price, and netting trades where you can all help. A lower brokerage shaves a little, but frequency is the lever that actually moves returns:
- Lower your turnover. Use slower signals, or make it harder to enter a position than to keep one. Novy-Marx and Velikov found this "buy/hold spread" was the single most effective simple way to cut costs.
- Raise the profit per trade. Filter out marginal signals so that the trades you take have a larger expected move relative to their cost.
- Trade liquid instruments. Tight spreads and deep order books cut both spread and impact.
- Use limit orders where the strategy allows. You save the spread, at the risk of not being filled when you most want to be. Test the fill rate with care, since a backtest that assumes every limit order fills is its own kind of overfitting.
- Watch flat fees on small trades. A flat ₹20 of brokerage is 0.02% of ₹1 lakh but 0.3% of a ₹6,500 option premium. Where fees are fixed per order, trade in larger, fewer orders (our article on starting capital shows what fixed costs do to small accounts).
- Choose the cheaper wrapper. The same exposure can cost very different amounts as delivery equity, intraday equity or futures.
Frequently asked questions
How much do transaction costs reduce trading returns?
Roughly the cost per round trip times the number of round trips a year. At 0.2% per round trip, a strategy trading 50 times a year gives up about 10 percentage points of return annually, while the same cost on a strategy trading three times a year takes about 0.6 points.
What is slippage in algorithmic trading?
The difference between the price when your strategy decided to trade and the price you actually got. It comes from the bid-ask spread, from the price moving while your order travels, and from your own order moving the market. Measure it live by recording both prices for every trade.
What are the transaction charges for intraday trading in India?
At a flat-fee discount broker, a ₹1 lakh intraday round trip costs about ₹83, or 0.08%, in brokerage, STT, exchange fees, stamp duty and GST, at rates published in September 2026. Spread and slippage are extra.
How do I include transaction costs in a backtest?
Model every explicit charge from your broker's schedule, add half the bid-ask spread per side for market orders, add slippage for fast-moving signals, and test how performance changes as costs rise. If the strategy only works at costs below what you'll really pay, it doesn't work.
Key points
- Transaction costs include brokerage, taxes and fees, the bid-ask spread and slippage, and the last two never appear on your contract note.
- Annual cost is roughly the cost per round trip times round trips a year, so frequency matters more than the fee schedule.
- In India, an intraday equity round trip costs about 0.08% and a delivery round trip about 0.22% before spread, and F&O STT went up again on 1 April 2026.
- In our Nifty test, a 3-day momentum rule's Sharpe ratio fell to zero at about 11 basis points per side, while a 200-day rule barely moved at 20.
If you'd like to find your own strategy's break-even cost, Quantra's backtesting courses show how to run a cost-sensitivity test like the ones above, and EPAT covers execution and realistic backtesting in more depth.
Sources: Zerodha charges page and brokerage schedule, read 28 September 2026. NSE circular NSE/FA/73061, 27 February 2026. Union Budget 2026-27 STT changes, effective 1 April 2026, as reported by ICICI Direct and HDFC Securities. SEBI study of intraday traders in the equity cash segment, press release 24 July 2024. Novy-Marx and Velikov (2016), "A Taxonomy of Anomalies and Their Trading Costs", Review of Financial Studies 29(1). Frazzini, Israel and Moskowitz (2018), "Trading Costs", working paper. Tóth et al. (2011), Physical Review X 1. Chan, "Beware of Low Frequency Data", epchan.blogspot.com, 13 April 2015. SPY and Nifty 50 tests: Yahoo Finance daily data, our calculations; Sharpe ratios computed without deducting a risk-free rate.
Interested in algorithmic trading?
Connect with an EPAT career counsellor to create a personalised quant career path for you