

In late January 2026, Apple's share price paused for three days. Each daily candle on the chart was small. Then on 2 February, the price shot up. It moved almost twice as far as on a normal day. Supply and demand traders call this pattern a demand zone. It's a price area where buyers seemed to take control.
The theory says buyers will step in again when price returns. So we set up a paper trade. We rebuilt it afterwards from daily prices. The plan used only what the chart showed on 2 February.
Price came back to the zone ten days later. It touched the zone and bounced, as the theory says it should. On paper, the trade still lost about $1,000.
How can a zone hold and still lose money? And was that bounce a real signal, or just luck? We wanted to know, so we tested the idea on more data. We used almost 11 years of daily prices. The data covered eight large US stocks and funds. A script found every zone, so our eyes couldn't pick the good ones. Then we checked how often price reacted on its return. At the zones, price reacted about 43% of the time. At random levels of the same size, it reacted about 40% of the time.
That gap is much smaller than most trading books suggest. So what is a zone good for? Let's start with the Apple trade. You only need to know how to read a candlestick chart. If that's new to you, start with our guide to candlestick patterns.
What happened to Apple's February zone?
First, the numbers. AAPL printed three small candles on 28, 29 and 30 January 2026, then closed at $269.28 on 2 February. That day's range was 1.93 times its average true range (ATR). Nearly all of that move was in one direction.
The zone runs from the top of those three candles, $261.19, down to their lowest low, $251.50. (Prices are dividend-adjusted, so they may differ by a few cents from quotes at the time.)
The entry was a buy limit order at $261.19. The stop-loss went at $251.40, 10 cents under the zone. That's $9.79 of risk per share. Risking $1,000, or 1% of a $100,000 account, buys 102 shares. The target was $280.77, twice the risk. The 10 cents, the 1% and the 2:1 ratio are common habits, but they're arbitrary.
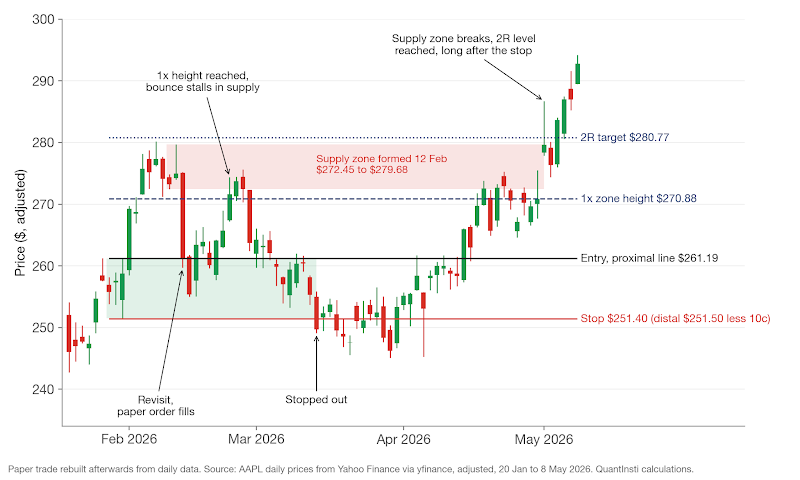
The paper order filled on 12 February, and it didn't feel like buying at support. AAPL opened at $275.10 and slid to $259.72 that day. That's common at a demand zone. By design, a buy limit fills when sellers are pushing price down, exactly when you'd least like to be a buyer. The next day price dipped to $254.99, still above the zone's bottom edge.
By 24 February price had climbed one full zone height above the entry, to $270.88. Many zone traders would call that a successful test. But the rally stalled between $274 and $276 for three days and fell back. On 13 March it hit the stop, for a loss of $998 before costs. The 2:1 target wasn't reached until 1 May, seven weeks after the paper trade was closed.
Why did it stall right there? Here's the twist. The sharp drop on 12 February that filled the order had also created a supply zone above it, from $272.45 to $279.68. The bounce ran straight into it, and the $280.77 target sat just above that zone's top edge. The plan asked price to climb through fresh selling before it paid anything. Keep that overhead zone in mind. We'll come back to it.
What is a zone, and why do traders believe in it?
Supply and demand trading is a form of price action trading. A demand zone is an area where buyers took control and pushed price up fast. A supply zone is the opposite, an area where sellers pushed it down fast.
Every zone has two parts. The base is a short pause of one to three small candles. The leg-out is the strong move that leaves it. Two lines frame the base. The proximal line is the edge nearest the current price, so price touches it first on the way back. The distal line is the far edge. If price trades past it, the zone has failed.
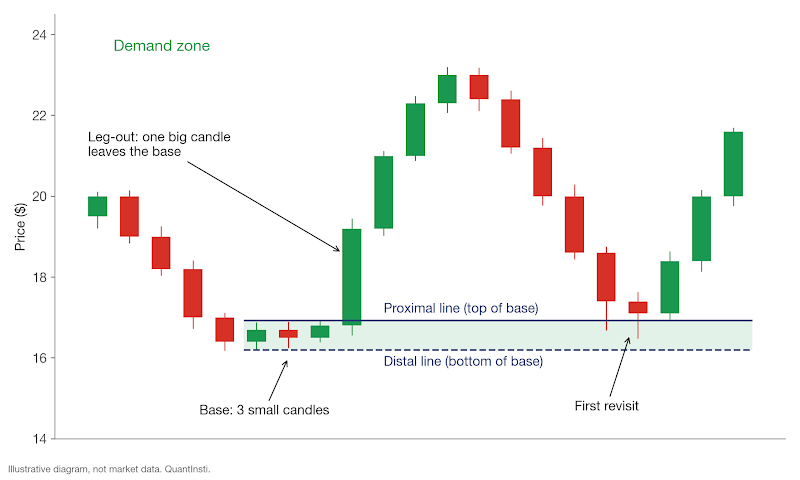
But why would price react there a second time? A large fund often can't buy a big position in one go without pushing the price up against itself, so it buys in pieces. Some of those orders were still unfilled when price ran away from the base, the theory says, and they'll be waiting if price comes back. An article by Online Trading Academy's Brandon Wendell describes these levels as places where unfilled institutional orders are likely to be left over (Wendell, 2013). The method is widely associated with Sam Seiden, who taught it through the same academy (FXStreet Q&A).
Does that hold up? The first half is reasonable, because large orders are commonly split up. The second half is a bigger ask. It assumes the leftover orders sit right at the base and are still there weeks later, and a daily chart can't show you either of those things.
If it helps, think of a demand zone as support and a supply zone as resistance, drawn as a band with two edges instead of one line. The second edge tells you where you're wrong.
Which base patterns make a zone?
Traders name four patterns. Rally-Base-Rally (RBR) is a demand zone inside an uptrend. Drop-Base-Rally (DBR) is a demand zone at a bottom. Drop-Base-Drop (DBD) and Rally-Base-Drop (RBD) are the supply versions, one in a downtrend and one at a top.
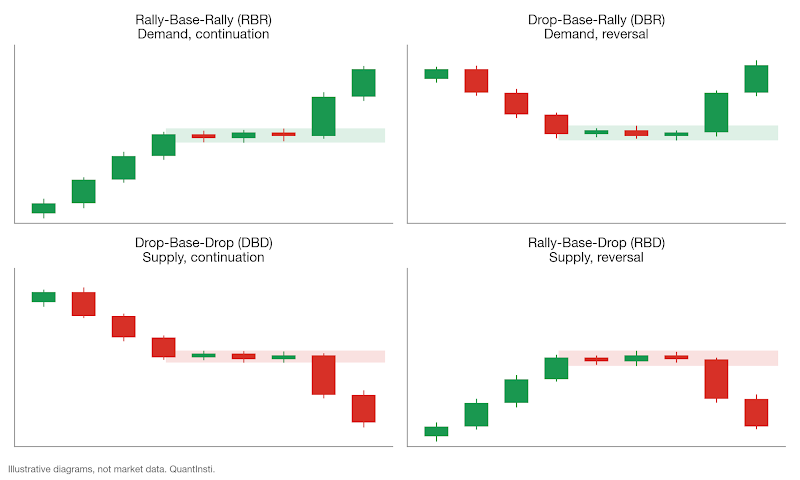
There are four names, but one rule decides them. A strong leg-out up makes demand, and a strong leg-out down makes supply. What came before only tells you whether it's a continuation or a reversal, and that depends on how far back you look.
Take the Apple zone. AAPL's close fell from $273.86 to $246.03 between mid-December and 20 January, so the February zone reads as a Drop-Base-Rally. But from 23 to 27 January it bounced from $247.37 to $257.57, so it also reads as a Rally-Base-Rally. It's the same zone with two labels, depending on where your eye starts.
We draw the edges at the wicks, so the zone covers every price traded in the base. And keep the base short. Fifteen candles of sideways drift is a trading range, not a zone.
How do you find zones without fooling yourself?
Why not just draw them by eye? Two traders will mark the same chart differently. Worse, the big move away from a zone is what catches your eye, so you notice the zones that worked and miss the ones that failed. And you can't rerun your own eye over ten years of data without hindsight creeping in.
A script applies the same rules to every candle. The one below downloads daily prices with the yfinance library (yfinance on PyPI). It marks small-body base candles and big leg-out candles, joins them into zones, and labels each zone as fresh, tested or broken. The thresholds sit in the settings block at the top, and each one is a choice we made, not a law.
Look at the line that shifts the ATR by one day. Without that shift, each candle would be judged against an ATR that already includes itself, which makes big candles look smaller than they are.
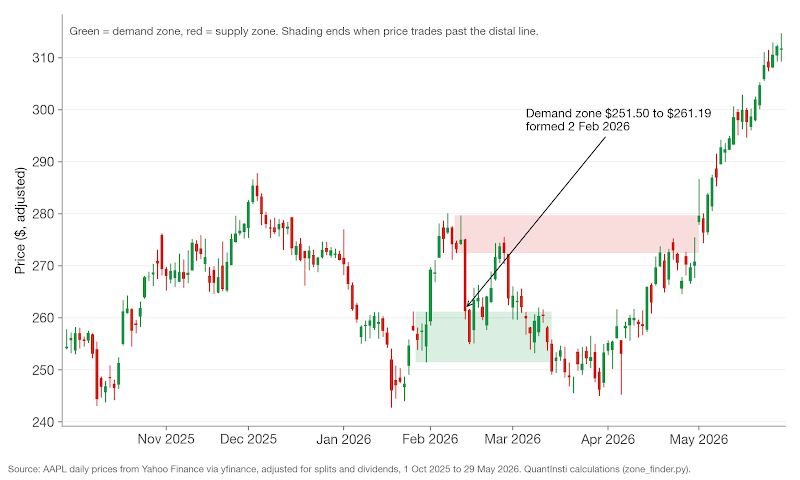
Here's the output for AAPL, run on 3 November 2026 on prices up to 2 October 2026:
Our February demand zone is in there, marked broken. So is the 12 February supply zone that stopped the bounce. Over almost 11 years, 38 of AAPL's 45 zones were eventually broken, which is what you'd expect, since price moves through most levels given enough time. (The "status" column is measured from the last date in the data. We've printed only older zones that have already resolved, because the article is about the method, not about where Apple might trade next.)
Do zones hold more often than random price levels?
One trade proves nothing, in either direction. But if the leftover-orders theory is right, price should react at zones more often than at other levels of the same size. We can test that.
We took daily prices for SPY, QQQ, AAPL, MSFT, AMZN, JPM, XOM and GOOGL, from 4 January 2016 to 2 October 2026. For every zone the script found, we waited up to 60 trading days for price to touch the proximal line. From that first revisit we asked one question. Does price move one zone height away (a reaction) before it trades past the distal line (a break)?
For each real zone we also made 20 fake ones. They had the same type, the same height as a percentage of price and the same distance from price, but sat on random dates. The 60-day window, the one-height target and the count of 20 are arbitrary choices. One limit of this design: real zones always follow a big candle, and random levels don't, so the comparison isn't matched on volatility.
A daily candle also can't show whether the high or the low came first. So if the revisit candle also broke the distal line, we counted it as a break. That cautious rule applies to real zones and random levels alike, so the comparison stays fair.
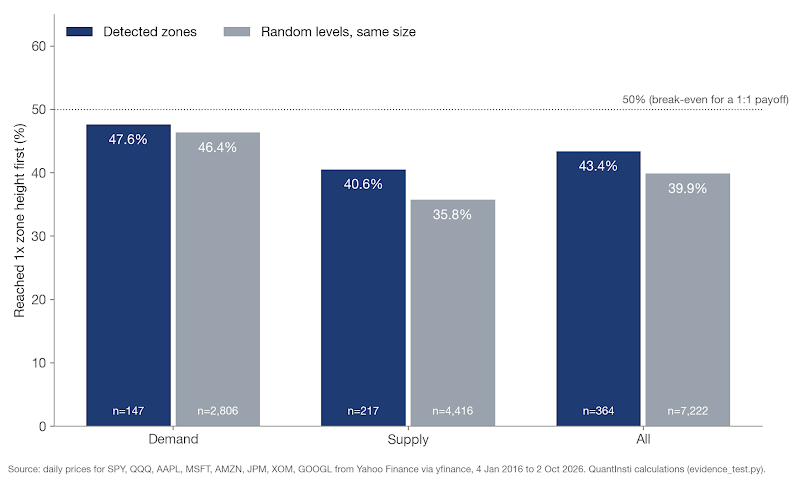
Of 419 zones with enough data after them, 54 got no revisit within 60 days and one stayed unresolved. That left 364 first revisits with a clear result. Zones reacted 43.4% of the time (158 of 364). Random levels reacted 39.9% of the time, across 7,222 revisits. Zones came out 3.5 percentage points ahead.
Is that an edge? We can't say so. The standard error of the zone figure is 2.6 points (and since the eight symbols tend to move together, the real uncertainty is probably larger). That's roughly how much a figure like this would wobble on a fresh sample. A gap smaller than about two standard errors could easily be luck, and ours is under that.
That surprised us, given how confidently zones are taught. On daily bars of large US stocks, with these settings, zones did about as well as random levels. Other settings or intraday data might change that.
So how should you use a zone?
If zones barely beat random lines, are they useless? Not quite. Go back to the Apple trade. The zone gave us a place: where to buy, where we'd be wrong, and where trouble was waiting overhead.
Treat a zone as a location to plan risk around. The reason to trade should come from somewhere else, such as the trend. Beginners often do it the other way round and treat the zone itself as the signal.
Why does the stop go beyond the distal line?
If buyers really were waiting in the base, price shouldn't trade below its lowest low. So the distal line is where the idea is clearly wrong. A stop inside the zone tends to get hit by ordinary noise, and a stop far beyond it only makes the loss bigger. A small buffer past the line (our 10 cents) keeps a tick-perfect touch from taking you out.
Would a wider buffer have rescued the failed trades? In our test, almost never. Of 206 first revisits that broke the distal line, only one went less than a quarter of a zone height past it (an arbitrary cut-off) and then recovered to the target.
A stop also doesn't lock in your exit price. Once it's triggered it becomes a market order, and in a fast market the fill can land well below the stop level (Investor.gov: stop, stop-limit and trailing stop orders). Apple opened at $255.02 on 13 March, above the stop, so the paper loss stayed close to plan. An overnight gap through the stop would have cost more.
The zone's height also sets your position size. A tall zone means a distant stop, and fewer shares for the same $1,000 of risk.
Is a fresh zone better than a tested one?
"Fresh zones only" is one of the most repeated rules in zone trading. The idea is that each return uses up some of the waiting orders. Does the data agree?
Not really. Of the 158 zones whose first revisit reached the target, 138 had a second revisit that resolved. Those reacted 47.8% of the time, with a standard error of 4.3 points. That isn't weaker than the first revisit's 43.4%, and it isn't clearly stronger either. (The sample is also biased, because only zones that survived once get a second test.) Our data couldn't confirm the freshness rule.
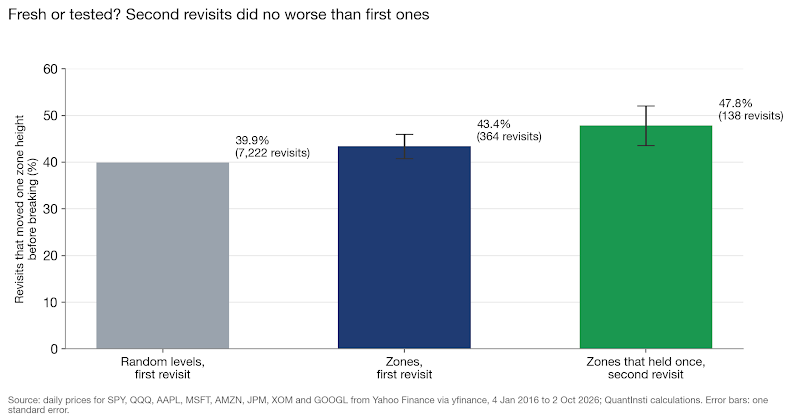
I'd still stick to first revisits, for a practical reason. A fresh zone is fixed before anything happens at it, so there's less room to talk yourself into a level after the fact.
Does the target matter more than the zone?
Here's something odd. The Apple trade counts as a success under the one-height test and a $998 loss under the 2R plan. 2R means twice the amount risked (R is the risk per trade, from entry to stop). The zone and the entry are identical. Only the target changed.
We reran the test with a 2R target and the stop at the distal line. That also changes the break-even rate, which is the hit rate you need just to cover losses before costs.
Target | Break-even hit rate | Zones | Random levels | Zone result per trade, before costs |
1 zone height (1:1) | 50.0% | 43.4% (364) | 39.9% (7,222) | -0.132R |
2R (2:1) | 33.3% | 31.6% (364) | 27.9% (7,154) | -0.052R |
Both versions lost money before costs, on zones and on random levels alike. The bigger target helped, and so did using a zone rather than a random level, by similar amounts of about 0.07R to 0.11R per trade. Neither difference is large enough to separate from luck on 364 trades, and neither was enough to break even.
Remember the overhead supply zone? It was on the chart from the close of 12 February, the day the paper order filled. A target just below its $272.45 edge would have been hit on 24 February. That's hindsight on one trade, and we didn't test a "take profit before the opposing zone" rule across the sample. Treat it as a sensible planning habit, not a proven one.
Why did supply zones do worse in a rising decade?
Supply zones reacted 40.6% of the time and demand zones 47.6%. But random supply levels trailed random demand levels by even more (35.8% against 46.4%), so the gap comes mostly from the market. Supply zones did beat random supply levels by about 5 points, but with 217 trades and a standard error of 3.3 points, that isn't clearly beyond luck.
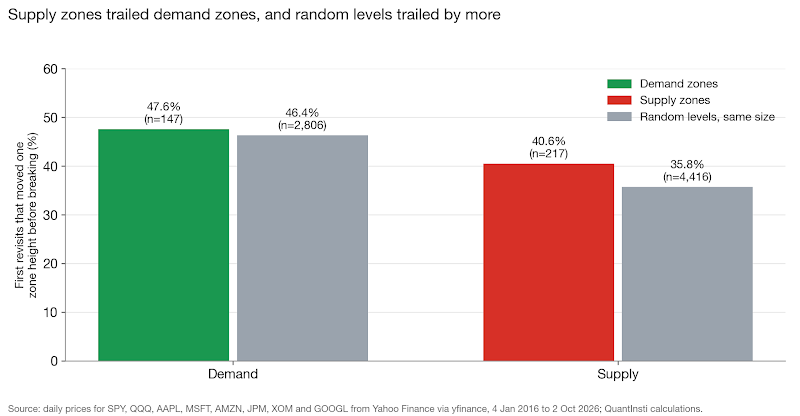
And the market rose a lot. In our data, SPY's adjusted price (which includes dividends) grew 4.55 times over the test period. Price kept climbing back into supply zones: 90.5% got a revisit within 60 days, against 82.6% of demand zones.
Demand zones did clear the 2R break-even, at 38.8%, but that's only about 1.4 standard errors above 33.3%, before costs. Random demand levels managed 36.3%. The market's drift, not the zone, seems to be doing the work. In this decade, buying dips beat selling rallies almost wherever you drew the line, and a falling decade could flip that. If you lean with the larger trend, know that the trend is what you're betting on.
What should you check before trading a zone?
Back to the question from the start. What was the Apple zone for?
It gave us everything except a reason to expect a bounce. In hindsight, the paper trade lost because the plan asked price to climb through overhead selling. These are the checks we'd run before taking a zone trade:
- The stop sits just beyond the distal line, and the position size comes from that distance.
- The target is checked against opposing zones. If one is in the way, consider taking profit before it, and test that habit on your own data first.
- Your tested hit rate for that target is above its break-even rate, after costs.
- The zone points the same way as the larger trend, or you have a clear reason it shouldn't.
- You have a reason to trade that goes beyond the zone itself.
What does the test say about zones, then? Across almost 11 years and eight US names, price reacted at zones only a little more often than at random lines, and broke through most zones in the end. A zone is a sensible place to put an entry and a stop. On this evidence, it isn't a reason to expect price to turn. Before you put money behind any zone rule, backtest it on your own markets, with your own costs. Your numbers may well differ from ours, and for your market, yours are the ones that count.
Not sure where to start with quant trading?
Schedule a call with an EPAT career counsellor for guidance on the right path.
Frequently asked questions
What is supply and demand in trading?
It's a way of reading price charts that marks areas where one side clearly won. A demand zone marks a spot where buyers drove price sharply higher. A supply zone marks a spot where sellers drove it sharply lower. Traders then watch for a reaction when price comes back to that area.
How do you find a supply and demand zone on a chart?
Start by looking for a big, fast candle. Then look just before it for one to three small candles. That pause is the base. Draw lines at the top and bottom of the base, using the wicks. A strong move up out of the base makes demand. A strong move down makes supply.
What is the difference between supply and demand zones and support and resistance?
They're closely related ideas. Support and resistance are usually drawn as single lines. A zone is a band with two edges instead. A demand zone works like support, and a supply zone works like resistance. The far edge is useful. It shows where the trade idea is wrong.
Does supply and demand trading really work?
Not clearly, in our historical test. We tested zones on daily prices of eight large US stocks and funds. Price reacted at zones about 43% of the time. At random levels of the same size, it reacted about 40% of the time. That gap was too small to rule out luck. Other settings or intraday data might give different results.
Where do traders put the stop-loss on a zone trade?
It usually goes just beyond the distal line, the far edge of the zone. If price trades past that edge, the zone has failed. A stop inside the zone can get hit by normal price noise. Once triggered, a stop becomes a market order. In a fast market, the fill can land below the stop price.
Are fresh zones better than tested zones?
Our historical test couldn't confirm that. Many traders only trade a zone's first return. They believe each visit uses up some of the waiting orders. In that test, second returns reacted about 48% of the time. First returns reacted about 43%. The gap was small enough to be luck. Also, only zones that held once got a second test.
Sources
- Wendell, B. (2013). Supply and Demand, Isn't That Support and Resistance? FXStreet: https://www.fxstreet.com/education/lesson-from-the-pros-stocks-201301220000
- Ferrer, V. Supply and Demand Q&A With Sam Seiden. FXStreet: https://www.fxstreet.com/education/lessons-from-the-pros-200805190000
- Wikipedia. Average true range: https://en.wikipedia.org/wiki/Average_true_range
- Investor.gov (US SEC). Limit Orders: https://www.investor.gov/introduction-investing/investing-basics/glossary/limit-orders
- Investor.gov (US SEC). Stop-Loss Orders: https://www.investor.gov/introduction-investing/investing-basics/glossary/stop-loss-orders
- Investor.gov (US SEC). Investor Bulletin: Stop, Stop-Limit, and Trailing Stop Orders: https://www.investor.gov/additional-resources/news-alerts/alerts-bulletins/investor-bulletin-stop-stop-limit-trailing-stop
- yfinance (Python library for Yahoo Finance data): https://pypi.org/project/yfinance/
- Yahoo Finance. Apple Inc. (AAPL) historical data: https://finance.yahoo.com/quote/AAPL/history/
- QuantInsti. Price Action Trading: Strategies, Algo Trading and Python: https://blog.quantinsti.com/price-action-trading/
- QuantInsti. Candlestick Patterns: How To Read Charts, Trading, and More: https://www.quantinsti.com/articles/candlestick-patterns-meaning/
- QuantInsti. What Is Backtesting & How to Backtest a Trading Strategy Using Python: https://www.quantinsti.com/articles/backtesting-trading/
Next step
To turn a chart idea like this into rules you can test properly, with costs, slippage and out-of-sample checks, look at EPAT, the Executive Programme in Algorithmic Trading by QuantInsti. It covers strategy design, Python, backtesting and risk management.
Disclaimer
This article is for education only. QuantInsti is not registered with SEBI as a Research Analyst or an Investment Adviser, and nothing here is investment advice, a research report or a recommendation to buy, sell or hold any security, fund, index product, currency or crypto asset. Where we name a security, a price or a date, it's there only to illustrate a concept with historical data. It isn't a view on where that price will go.
Past results don't indicate future results, and that applies even more to backtested or simulated results, which are built with hindsight and can leave out costs, slippage and execution limits that change the outcome. Trading involves substantial risk of loss. With leveraged products such as futures, options, CFDs and crypto derivatives, you can lose more than the money you put in.
Do your own research. Before you make any investment or trading decision, consult a SEBI-registered Investment Adviser or Research Analyst who can take your own circumstances into account.