

It was Monday, 21 September 2026. The US stock market opened at 09:30 New York time. Oil prices and bond yields were falling back after a jumpy week. For the first five minutes, QQQ moved inside a narrow band of about one dollar. Traders call that band the opening range.
A simple rule watches this band. If the price goes above the top, the rule buys. It places a stop-loss at the bottom of the band. On this day, that meant risking about one dollar per share.
At 09:35, the price went above the band, and the rule bought. Then chip stocks pushed the whole market up. Soon after 12:30, QQQ reached the rule's profit target. That target was ten times the amount at risk, so the rule sold. The gain was about $1,300. The account held about $23,000 at the time. By the close, the Nasdaq Composite had risen to a record high.
That trade never happened in real life. It's a paper trade from our own backtest, rebuilt afterwards from historical data. And this was the best day in our whole test.
Days like that one are why people love this strategy. You may have seen a bigger number, too. A research paper reported a backtest return of 1,484%. The test covered about seven years, starting in 2016. It used a fund with three times the daily moves of QQQ. It also assumed no slippage.
Then, in 2026, an independent trader rebuilt the same rule and added costs. His result on the Nasdaq was 0.002R per trade. Here, R means the amount you risk on one trade. That makes 0.002R almost nothing.
What about our own test? Take out that one Monday, and our classic version loses money.
What is an opening range breakout, and why the first five minutes?
An opening range breakout (ORB) is an intraday rule. You've already seen the long side. If price instead trades below the range low, the rule sells short. Either way, the stop sits on the other side of the box, and any open trade is closed by the end of the day.
The idea is old. An early reference is Toby Crabel's 1990 book on opening range breakout, though his version measured the breakout as a set distance from the opening price, which he called the "stretch" (Oxford Capital Strategies).
But why the open? Because that's when many of the orders that piled up overnight arrive at once. We checked this on QQQ 5-minute bars from Yahoo Finance, from 4 August to 2 October 2026. On average, the first 5-minute bar held 8.7% of the day's volume. Spread evenly over the day's 78 bars, each would get about 1.3%. The first 30 minutes held 18.8%. Price moved the same way. The 09:30 bar's average high-to-low range was $2.21, while bars between 12:00 and 14:00 averaged $0.62.
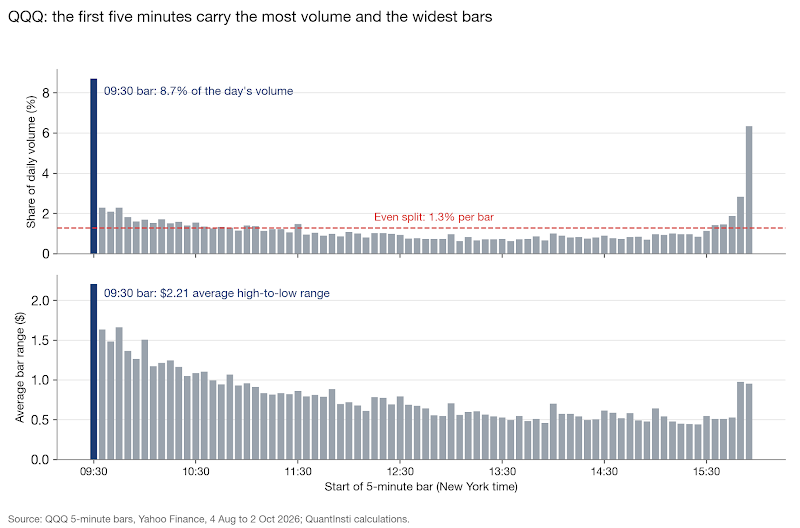
That burst is why traders like the open. It's also why fills are hardest to control in those minutes, and we'll come back to that.
What did the 1,484% study actually test?
The study is Carlo Zarattini and Andrew Aziz, Can Day Trading Really Be Profitable?, first posted in April 2023 (SSRN, full PDF). You'd expect it to test the breakout we just described. It doesn't.
The paper's rule looked only at the first 5-minute candle. If that candle closed up, they bought at the open of the second candle, at 09:35. If it closed down, they sold short at 09:35. A flat candle meant no trade. The stop sat at the other end of the first candle, the target was 10R, and anything still open was closed at the end of the day. Nothing has to break out. You're in the market at 09:35 almost every day, in whatever direction the first candle went. The paper itself calls it "a more simplistic version" of ORB.
A stop-out loses 1R. A 10R target needs a price to travel 10 times your risk in your favour.
On QQQ, from 1 January 2016 to 17 February 2023, the paper's backtest of this rule returned 676%. That's after commissions of $0.0005 per share, but with no slippage. Only 24% of trades won, and the average trade made 0.13R. Buying and holding QQQ returned 169% over the same stretch.
Where does 1,484% come from, then? The authors risked 1% of the account per trade, but they also capped the position at four times the account value. On many days that cap stopped the QQQ trade from taking its full 1% risk. That's why they ran the same signals through TQQQ, a fund built to move about three times as much as QQQ each day.
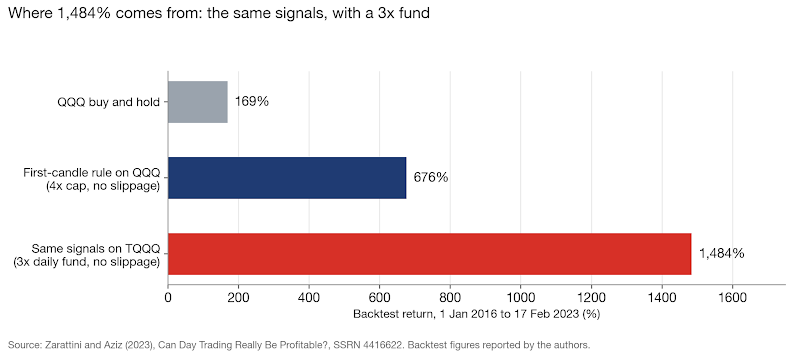
The authors are clear about all of this in the paper. The headline that travels without them isn't.
What does a buy-stop at the open do to your fill?
The usual way to trade a breakout is with a buy-stop just above the range high. A stop order waits until the price reaches your level. Then it turns into a market order (Investor.gov), and a market order takes whatever price is there. At midday that's usually your level, or a cent away. In the first few minutes, the next price can be well past it. Think about why a breakout happens at all: lots of orders are pushing the same way as yours.
Can a backtest see this? Not ours. It uses 5-minute bars, so it can't look inside a bar. It fills a buy-stop at the level unless the bar opened beyond it. In 40 classic-rule trades, only one entry opened past the level, and only by $0.02. That doesn't mean real fills were that clean. It means 5-minute data can't show the slippage. On 3 of the 43 days, a single bar crossed both the range high and the range low. We skipped those days, because there was no way to tell which level traded first.
The first-candle rule enters at 09:35, which is easier to test. But a real order sent at 09:35 still meets a fast market.
So how do you find out what costs do? You need someone who tested it with costs, on far more data than we have. In September 2026, Timon-pascal Krueger replicated the first-candle rule on five stock-index CFDs, using minute data from 2015 to mid-2026. Before costs, his Nasdaq result was +0.131R per trade with a 23.2% win rate, very close to the paper. The signal reproduced. Then he added spread and slippage. The Nasdaq result fell to +0.002R, and four of the five markets turned negative.
Does that mean the QQQ version loses money? Not necessarily. CFDs usually carry wider spreads than QQQ. What it does show is that the edge is about the same size as a realistic cost load. Krueger's spread and slippage took roughly 0.13R per trade, several times what our QQQ cost assumptions take (more on that below). Which one wins depends on which cost estimate is closer to your real fills.
Why does a tight stop make the leverage cap matter?
To size a trade, you divide the dollars you're willing to lose by R. Risk 1% of a $25,000 account with R of $2, and you get $250 divided by $2, or 125 shares.
Now picture a quiet open. The first bar is narrow, so R is small. Divide by a small number and you get a huge share count. The 4x cap stops that from becoming an enormous position. The level of the cap is arbitrary (we copied the paper's). When it kicks in is less obvious. With 1% risk and a 4x cap, it binds whenever R is under 0.25% of the share price. QQQ traded between about $703 and $751 in our sample, so any R under roughly $1.80 hit the cap.
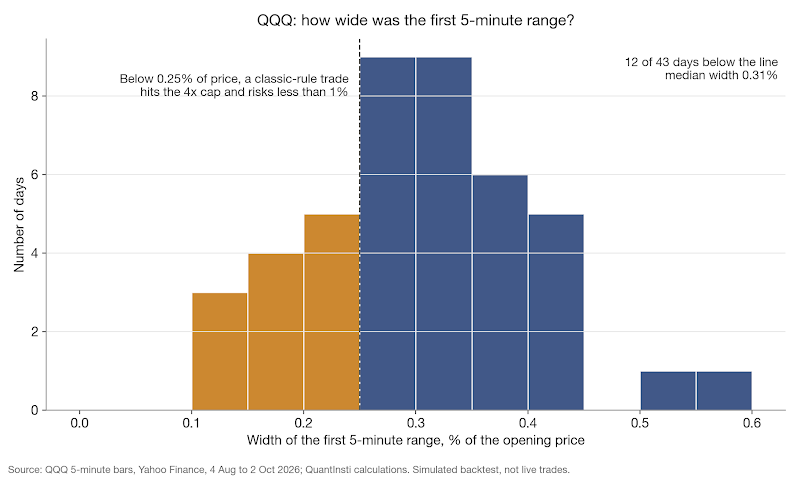
How often did that happen? More than you'd guess. The first bar was narrower than 0.25% of price on 12 of our 43 days, and the median width was only 0.31%. In the backtest, the cap bound on 10 of 40 classic-rule trades and 21 of 43 first-candle trades. (The first-candle stop is often closer than the full range, because the 09:35 entry sits inside it.) On the capped first-candle trades, the median risk taken was 0.52% of the account, and the lowest was 0.15%. You think you're running a 1% risk system. On quiet days you're running something smaller, and you never chose that.
The 10R target makes this matter more. For the classic rule, the median target sat 3.2% away from the entry. But QQQ's whole-day range had a median of 0.9% and a maximum of 2.6% in our sample. On a typical day, the target was simply out of reach, and the trade ran to the close. Only narrow-range days, with a small R, could ever reach 10R. And those are exactly the days the cap trims your size. The paper's fix, a 3x fund, raises your size on those days. It also raises it on every losing day.
Now look again at that Monday we started with, 21 September 2026. It was a chip-led rally: the Nasdaq rose 2.3% to a record, and AMD's market value touched about $1 trillion during the day (Yahoo Finance, 21 Sep 2026). Here's the classic 5-minute rule on that day, as our backtest traded it.
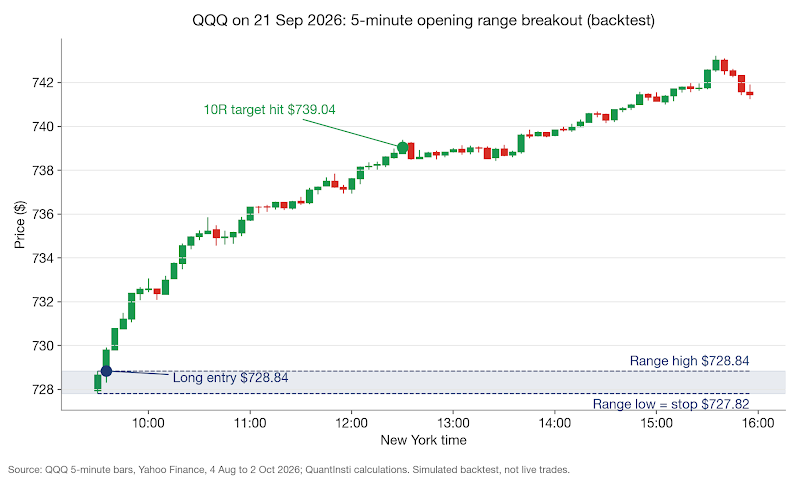
In the test, the buy-stop filled at the range high of $728.84 and the stop sat at $727.82, so R was $1.02. By then the simulated account stood at $23,414, after earlier losses. Risking 1% meant $234, or 229 shares. But 229 shares of a $729 fund is about seven times the account, so the cap allowed only 128 shares, roughly $93,000 of QQQ. The real risk was 128 times $1.02, or $131. That's 0.56% of the account.
The target was $739.04, worth $1,306 before costs and $1,300 after. Surprised? The best day of the whole sample was taken at a little over half size. And a candle-close entry would have bought near $729.80 instead. That makes R close to $2 and puts the target about $20 away, which QQQ never reached that day.
How do you backtest an ORB strategy in Python?
Enough of other people's results. Let's test it ourselves. The script runs both rules on the same data. "Classic" is the range breakout with a stop order. "First" copies Zarattini and Aziz. Both use a 10R target, an exit at the close, 1% risk and the 4x cap.
Most of the code is bookkeeping. The choices that matter are about what 5-minute bars can't tell you. A day where one bar crosses both sides of the range gets skipped. A bar that opens beyond a level fills at that open, because a gap jumps straight over your price. And when one bar touches both the stop and the target, the script assumes the stop came first. That's the safe guess when you can't see inside the bar.
Costs are $0.0035 per share commission each way, the Interactive Brokers rate used by Barbon, Zarattini and Aziz (2024), plus $0.02 per share slippage each way. The slippage figure is our guess. Given how stop orders behave at the open, treat it as a floor, not an estimate. yfinance only serves 5-minute bars for about the last 60 days. We used the sessions from 4 August to 2 October 2026, which gives 43 trading days.
What did 43 days of QQQ show?
The backtest sample runs from 4 August to 2 October 2026. That's one stretch of one market regime, which is another reason not to lean on it.
Rule (5-minute range) | Costs | Trades | Win rate | Avg R | P&L | Max drawdown |
Classic breakout | None | 40 | 35.0% | +0.21 | +$770 | -11.1% |
Classic breakout | Included | 40 | 35.0% | +0.18 | +$552 | -11.5% |
First-candle direction | None | 43 | 34.9% | +0.35 | +$1,731 | -8.6% |
First-candle direction | Included | 43 | 34.9% | +0.32 | +$1,474 | -9.0% |
Both rules ended the 43 days ahead in the simulation, and QQQ itself rose 5.84% over the same days. These are simulated trades on historical bars, not live results. Good news? Not really. The classic rule made about 2% on the account, so plain holding did better. The first-candle rule roughly matched holding, and it did it with a 9% drawdown along the way.
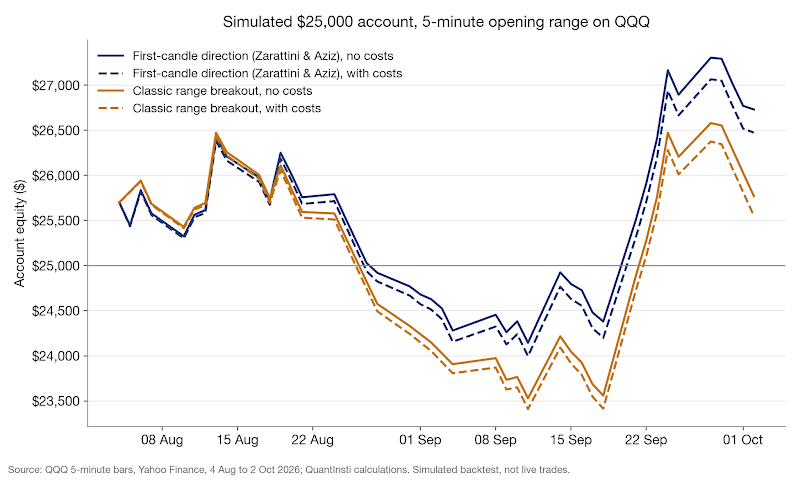
Look at the path, too. After a peak on 13 August, both accounts slid for about a month. The classic account fell 11.5%. It closed below its $25,000 start from 26 August until 22 September. Between 20 August and 4 September, it went 10 trades in a row without a winner. Then a few trend days lifted everything. For the classic rule, the three best trades added 17.7R, while all 40 trades together made only 7.4R. Take away the 21 September trade alone, and the average falls from +0.18R to -0.07R.
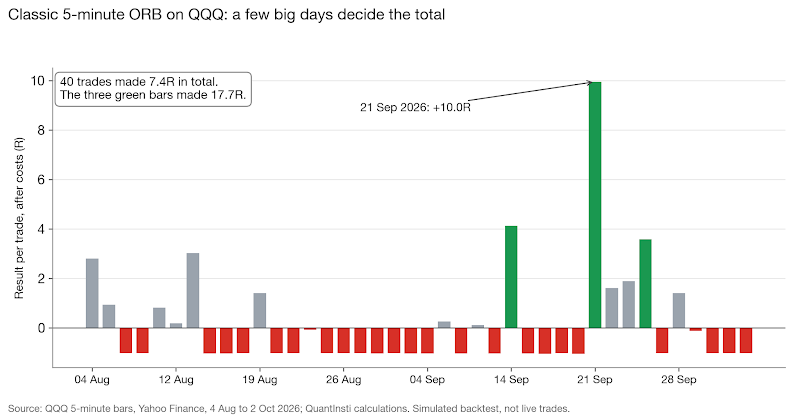
That's what a fat-tailed payoff feels like from the inside: most of the profit comes from a few rare, large wins. You spend weeks watching small losses stack up, and nothing tells you whether the strategy is resting or broken. That's when people tweak the rules, skip a day or quit. And in a strategy like this, the skipped day can be the one that would have paid for the month. If you can't sit through a stretch like late August to mid-September, the backtest's average won't help you much.
What about costs? They took only 0.02R to 0.04R per trade, because the opening range was around $2 on a typical day and our costs came to under $0.05 per share. That favours QQQ over the CFDs, though it rests on our guessed slippage.
Is five minutes special, or did we just pick a lucky setting? We also tried longer ranges for the classic rule.
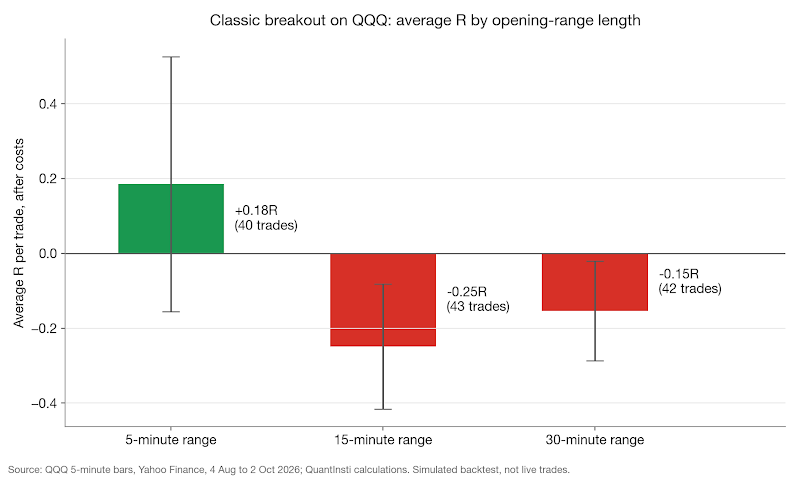
The 15-minute range lost $2,393 (-0.25R per trade) with a 13.6% drawdown. The 30-minute range lost $1,594 (-0.15R). Only the 5-minute range came out positive. That lines up with the Barbon, Zarattini and Aziz finding that the 5-minute range did best on high-volume US stocks from 2016 to 2023. But on 43 days, and with three lengths tried (one of them was always going to come out best), that agreement is weak evidence at best.
Why can't 43 days validate a 10R strategy?
This is the part we'd want to know before trading it. A handful of trades decide the result, and a handful can't measure much.
The classic rule hit its 10R target once in 40 trades. The first-candle rule hit it twice in 43. Each hit is worth about ten losing trades. The total mostly tells you how many big days happened to land in the window. It tells you very little about how often they'll come in future.
Want to see how fragile that is? Slide the window. We ran the classic rule on the first 39 of our 43 sessions, 4 August to 28 September. It made $1,376. Then we moved the same-length window four sessions later, to 10 August to 2 October. Now it lost $106. The two windows share 35 sessions. Four days in, four days out, and the sign of the result flips.
The statistics say the same thing. The standard error of the average R (roughly, how far the average could move by chance alone) was 0.34R for the classic rule and 0.39R for the first-candle rule. Neither average is even one standard error away from zero. We can't tell either result apart from no edge at all. The paper found 0.13R per trade over seven years. In our classic trades, R per trade had a standard deviation of 2.16R. At that spread, telling a 0.13R edge from zero at two standard errors would take about 1,100 trades. With one trade a day, that's more than four years.
What would you check before trusting an ORB backtest?
Go back to that Monday morning at 09:35. The range was narrow, the stop was close, and the buy-stop filled. Nothing on the screen said this would be the best day of the sample. The Friday before also had a narrow first bar and a close stop. That day the rule sold short at 09:35, and within about ten minutes it was stopped out for a $133 loss. Looking back, it's easy to tell the two days apart. At the time, it wasn't. None of this proves ORB doesn't work. It tells you where to look before believing any version of it, ours included.
When an ORB backtest lands in front of you, run these checks, roughly in this order:
- Which rule was tested? A stop-order breakout, a candle-close entry and a first-candle trade are different strategies.
- What's the result without leverage? Ask for R per trade before any percentage.
- How were fills modelled at the open? If stop orders fill at the level on 5-minute bars, the slippage is invisible. Rerun it with costs doubled.
- How often did the leverage cap bind? If it was often, your real risk on quiet days was below the stated 1%.
- How many trades made the money? Remove the best three days and see what's left.
- How long is the sample, and was any of it held back? A 10R strategy needs years of data, plus a period you didn't use to pick the settings. Slide the window a few days and see if the answer holds.
Want to take it further yourself? Rerun orb_backtest.py on several years of 5-minute QQQ data from a paid source, with slippage at double our guess, and see whether any first-candle edge shows up. (If you use 1-minute bars, resample them to 5 minutes first, because the script assumes 5-minute bars.)
Want to test strategies like this the right way?
Schedule a call with an EPAT career counsellor to talk through your options.
Frequently asked questions
What is the opening range breakout strategy?
An opening range breakout (ORB) is a same-day trading rule. It marks the high and low of the first few minutes of trading. A move above the high means buy. A move below the low means sell short. The stop goes on the other side of the range. Every trade closes by the end of the day.
Which timeframe is best for ORB: 5, 15 or 30 minutes?
No window is proven best. In our simulated QQQ backtest, from 4 August to 2 October 2026, only the 5-minute range ended positive after costs. The 15-minute and 30-minute ranges lost money. A 2024 study of high-volume US stocks also favoured 5 minutes. Still, 43 days and three settings tried make this weak evidence.
Does the opening range breakout strategy actually work?
The evidence is mixed. A 2023 paper's backtest of a first-candle version on QQQ averaged 0.13R per trade, from January 2016 to February 2023, with no slippage. A 2026 replication on index CFDs, using data from 2015 to mid-2026, then added spread and slippage. Its Nasdaq result fell to almost zero. Any edge looks about as large as trading costs.
Where does the 1,484% ORB return come from?
It's a backtest result from Zarattini and Aziz, covering January 2016 to February 2023. It didn't test a classic breakout. It traded the direction of the first 5-minute candle. It used TQQQ, a fund built to move about three times as much as QQQ each day. It also assumed no slippage. On QQQ itself, the same backtest returned 676%.
How many trades do you need to test an ORB strategy?
More than most people expect. A 10R strategy wins rarely, so a few big days decide the total. In our simulated QQQ trades, from August to October 2026, results swung widely from one trade to the next. At that spread, telling a 0.13R edge apart from zero would take about 1,100 trades. That's more than four years of daily trading.
What data do I need to backtest ORB in Python?
You need intraday bars with a time, open, high, low and close for each bar. Our script uses 5-minute QQQ bars. The free yfinance library only serves about 60 days of these, which is far too short. For several years of data, you'd need a paid source. If your bars are 1-minute, resample them to 5 minutes first.
Sources
- Zarattini, C. and Aziz, A. (2023, revised 2025). Can Day Trading Really Be Profitable? SSRN: https://papers.ssrn.com/sol3/papers.cfm?abstract_id=4416622. Full PDF: https://concretumgroup.com/wp-content/uploads/2026/02/Can-Day-Trading-Really-Be-Profitable.pdf
- Barbon, A., Zarattini, C. and Aziz, A. (2024). A Profitable Day Trading Strategy for the U.S. Equity Market (SSRN 4729284): https://alexandria.unisg.ch/handle/20.500.14171/122125
- Krueger, T. (25 Sep 2026). The opening-range breakout paper, replicated on five indices: gross reproduced, net zero. MQL5 blog: https://www.mql5.com/en/blogs/post/776235
- Investor.gov (US SEC), Stop Order: https://www.investor.gov/introduction-investing/investing-basics/glossary/stop-order
- Toby Crabel, bibliography (Day Trading with Short Term Price Patterns and Opening Range Breakout, 1990): https://en.wikipedia.org/wiki/Toby_Crabel
- Oxford Capital Strategies, Narrow range (Crabel's stretch entry): https://oxfordstrat.com/trading-strategies/narrow-range/
- Yahoo Finance (21 Sep 2026). Stock market today: Nasdaq surges 2% to record high as chip stocks rally, oil falls: https://finance.yahoo.com/markets/live/stock-market-today-monday-september-21-dow-sp-500-nasdaq-080214605.html
- QQQ 5-minute bars, Yahoo Finance via yfinance, 4 Aug to 2 Oct 2026: https://finance.yahoo.com/quote/QQQ/
If you want to build and test strategies like this with proper data, costs and risk controls, take a look at EPAT, the Executive Programme in Algorithmic Trading by QuantInsti.
Disclaimer
This article is for education only. QuantInsti is not registered with SEBI as a Research Analyst or an Investment Adviser, and nothing here is investment advice, a research report or a recommendation to buy, sell or hold any security, fund, index product, currency or crypto asset. Where we name a security, a price or a date, it's there only to illustrate a concept with historical data. It isn't a view on where that price will go.
Past results don't indicate future results, and that applies even more to backtested or simulated results, which are built with hindsight and can leave out costs, slippage and execution limits that change the outcome. Trading involves substantial risk of loss. With leveraged products such as futures, options, CFDs and crypto derivatives, you can lose more than the money you put in.
Do your own research. Before you make any investment or trading decision, consult a SEBI-registered Investment Adviser or Research Analyst who can take your own circumstances into account.