

Search "best AI trading bot" and you'll find hundreds of products, each with an equity curve that climbs steadily from the bottom left of the chart to the top right. The pitch is simple: skip the years of learning, buy an algo trading bot and switch it on. So does it work?
Sometimes, but the odds are worse than the marketing suggests. You can make money with a bought algorithm, yet the evidence gives you good reasons to expect much less than the sales page shows. Many products are sold mainly on a backtest, and the backtest you're shown is usually the best of many tries. An edge sold to many people also tends to shrink as they all trade it. And a black box gives you no way to tell a normal losing streak from a broken strategy. Buying is only reasonable when you can check a live track record that includes costs, and when you understand what the strategy does.
Why do backtests look so much better than live results?
Mostly because the backtest was chosen with hindsight. When a vendor tries hundreds of variations of a rule and keeps the one with the best past returns, that figure reflects luck as much as skill. Live, the luck doesn't repeat, so the results drift back towards ordinary.
Let's run the experiment a vendor might run. We took the Nifty 50 index from 2009 to 2017 and tested 449 versions of one of the oldest rules there is. Hold the index when a fast moving average is above a slow one, and step aside when it drops below. The fast average ranged from 5 to 100 days and the slow one from 20 to 300 days, and every buy and every sell was charged 5 basis points (0.05%).
The winner, a 100-day average against a 210-day one, had a Sharpe ratio of 0.95 over those nine years. (The Sharpe ratio is the annual return divided by its volatility, so higher means more return for each unit of risk. We haven't subtracted interest on cash, which in India ran at several percent a year over this period, so every Sharpe ratio here is higher than the textbook version would be. That doesn't change which rule came out on top or how it fared afterwards.) Simply holding the index managed 0.86 over the same years, so the rule looked like a modest improvement on doing nothing. So far, so good. Notice, though, that the winner sits at the very edge of the range we searched (100 days was the longest fast average we tried), which is itself a warning sign that the "best" setting is partly an accident of where we stopped.
Then we ran the same 449 rules from January 2018 to September 2026, a period none of them had seen (traders call this testing "out of sample", as opposed to the "in sample" period the rules were tuned on). The winner's Sharpe ratio fell to 0.20, which ranked it 378th out of 449. The ten best backtests averaged 0.89 before and 0.22 after. Holding the index, meanwhile, delivered 0.63. The rule that looked best in the backtest did far worse than doing nothing clever at all.
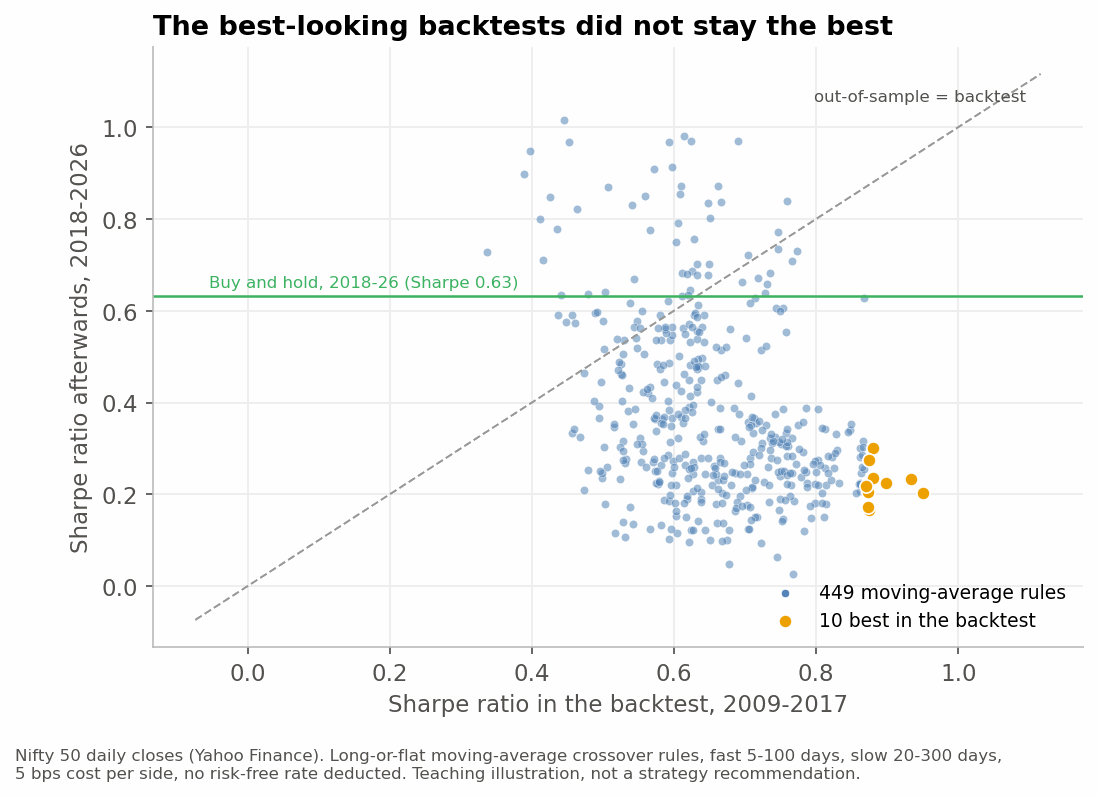
The dashed diagonal marks where a rule would sit if it did as well afterwards as in its backtest, and almost every dot is below it. Part of that is the market itself, since buy-and-hold also slipped from 0.86 to 0.63. But the ranking tells the more important story. Across the 449 rules, backtest Sharpe and later Sharpe were negatively correlated (about -0.36): the slow rules that suited 2009 to 2017 did worse afterwards, and faster ones that had looked mediocre did better. The ordering the search produced carried no useful information about the next nine years. That's what overfitting looks like, since the search found the settings that happened to suit one stretch of history, accidents included.
Our test has limits worth stating. It's one market, one family of rules and one split of the data, and 5 basis points per side is less than many retail traders pay. So it's an illustration, and on its own it proves little. The larger evidence points the same way, though. One of the largest public studies of this question used 888 strategies written by users of the Quantopian platform, each with at least six months of out-of-sample results from paper trading after the strategy was written. Wiecki and co-authors (2016) found that the backtest Sharpe ratio explained less than 2.5% of the variation in out-of-sample Sharpe. They also found that the more a strategy had been backtested, the wider the gap between its backtest and what followed, which is what you'd expect if much of the extra testing was curve fitting.
How many tries does it take to fake a good backtest?
Fewer than you'd think. Suppose none of your strategy ideas has any edge at all, so each one's daily returns are pure noise. Test one and its backtest Sharpe will hover around zero. Test a hundred and keep the best, and the best will look quite good.
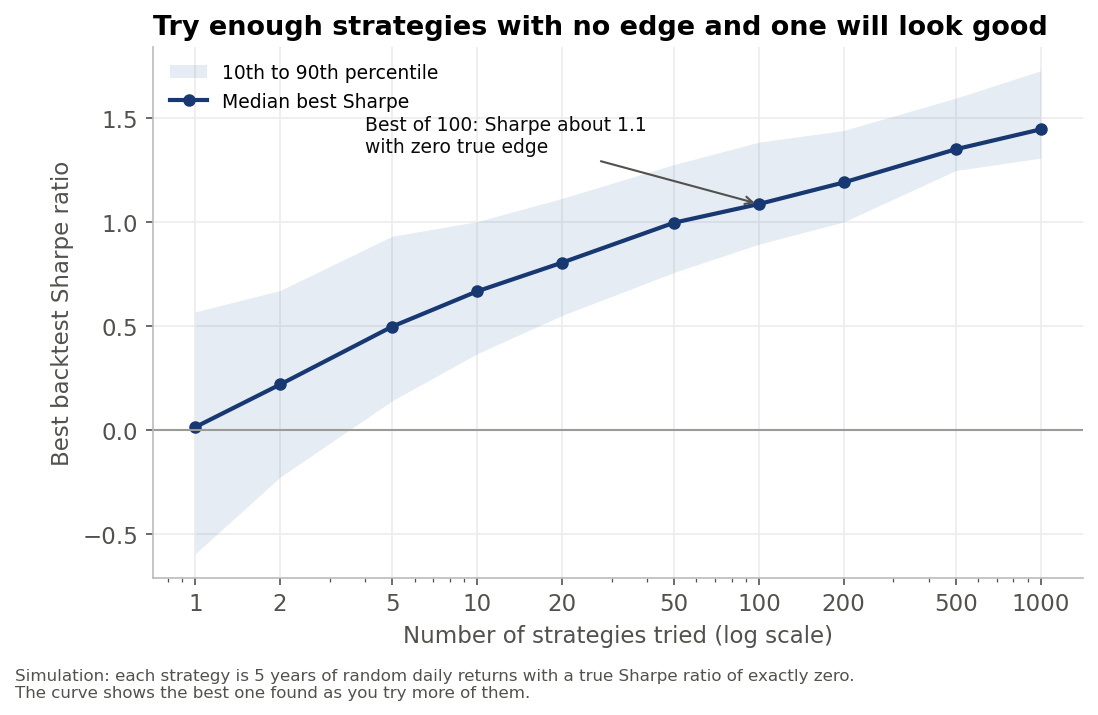
In our simulation the best of 100 zero-edge strategies had a median backtest Sharpe of about 1.1 over five years. Bailey, Borwein, López de Prado and Zhu (2014) worked out the same result on paper: with five years of data, trying about 45 independent configurations is enough to expect a Sharpe of 1 in the backtest and 0 afterwards. Variations of one rule are closely related, so they count as fewer independent tries than their number suggests, but they still add up. Bailey and López de Prado later turned this into a correction called the deflated Sharpe ratio, which marks a backtest down for the number of trials behind it. Their broader point is the one to remember as a buyer. A backtest that doesn't tell you how many variations were tried can't be judged, because you have no idea how much of it is luck.
Vendors almost never tell you that number. That's not always bad faith (many simply don't keep count), but it means the curve on the sales page is the maximum of an unknown number of tries, and you should discount it accordingly.
Why would anyone sell a profitable algorithm?
It's the right question to ask, and it has a plain answer: a genuine edge is a limited resource. If a strategy buys a stock just before it rises, every extra rupee following the same signal pushes the entry price up and the profit down. Sell the strategy to thousands of subscribers and they end up competing with each other for the same trades.
Academic research shows the same decay on a larger scale. McLean and Pontiff (2016) followed 97 stock-return patterns that had been published in finance journals. Returns were about 26% lower after the original study's sample period ended, and about 58% lower once the paper was out. The first drop is roughly what you'd expect if part of each original result was luck, the overfitting problem from earlier. The authors attribute the further drop mainly to investors reading the paper and trading the signal. Even so, the average pattern kept some of its return.
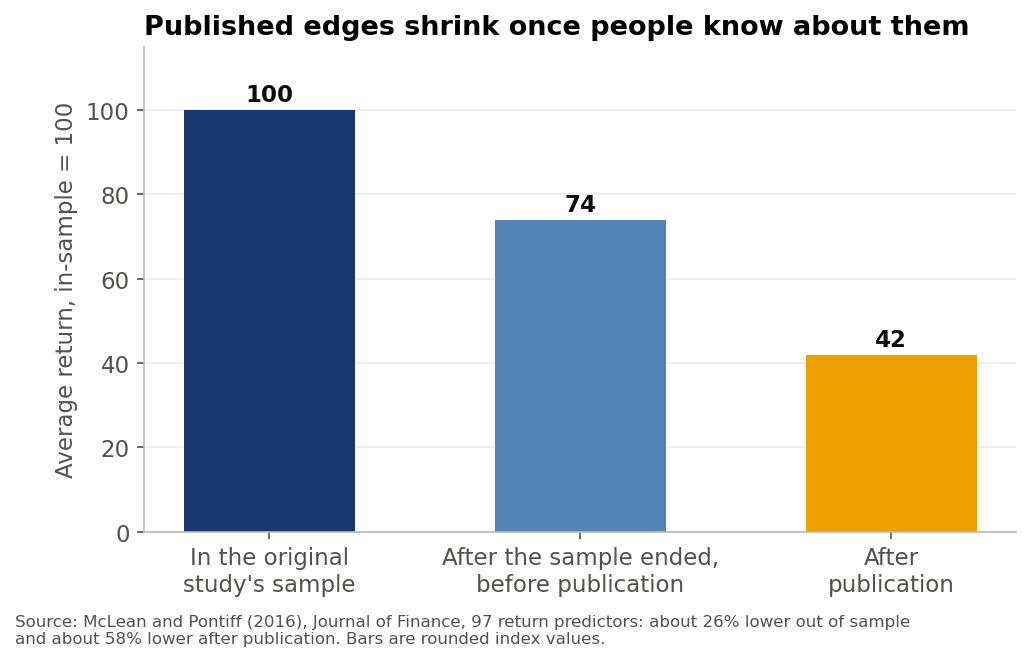
A published paper is, in effect, an edge given away for free, and a strategy sold to a crowd of subscribers is the same thing with a price tag. So a seller with a real, scalable edge usually has more reason to trade it quietly than to sell it. There are legitimate exceptions: the seller may lack capital, the strategy may suit a market they don't trade, or they may simply earn more from software than from trading. But the question deserves an answer before you pay.
What's wrong with a black box?
When you can't see the logic, you can't interpret the losses. Every strategy has drawdowns (stretches where it falls below its previous high), and a good one can spend months underwater. If you know it's a trend-following system, you know that choppy, sideways markets are its bad weather, and you can judge whether the current drawdown is normal. With a black box, a losing month tells you nothing, and many buyers do the natural thing and switch it off at the bottom.
A black box also can't adapt. When the market's character shifts (volatility halves, say, or a rule change alters how a contract trades), you're left waiting for the vendor to notice.
In India there's a regulatory angle too. SEBI's retail algo framework was set out in a circular of 4 February 2025 and has been fully applicable to brokers since 1 April 2026. Under it, providers offering algos to retail clients through brokers must be empanelled with the exchanges, and each algo's orders carry an exchange-issued ID. Providers of black-box algos, whose logic isn't disclosed to the user, must also register with SEBI as research analysts and keep a research report for each algo.
Registration doesn't make a product profitable. But a provider selling algos through a broker should be able to show its empanelment (and, for a black box, its research analyst registration), and if it can't, ask why before you pay. SEBI has also warned investors, back in June 2022, that unregulated algo platforms advertising high returns offer no grievance redressal if things go wrong.
When does buying make sense?
Buying isn't always a mistake. It's reasonable when you can verify a live track record net of costs, you understand what the strategy does and can sit through its drawdowns, the price is fair next to the cost of building it yourself, and you're paying for convenience rather than a borrowed edge. In practice that means several conditions holding at once:
- There's a live track record as well as a backtest. Ideally a year or more (and even a year is a short sample), including real commissions and slippage, and verified by a broker statement or a third party rather than a screenshot. Our article on transaction costs shows how much they can change the picture.
- You know the worst drawdown and could sit through it. A strategy with a 35% historical drawdown will, sooner or later, show you one of similar size or larger. If that would make you switch it off, it's the wrong strategy for you, however good the average looks.
- The logic is explained, at least in outline. You don't need the code, but you should know what kind of strategy it is (trend following, mean reversion, options selling) and when it's expected to struggle.
- It fits your capital, market and hours. A strategy built for US futures may not translate to Nifty options, and one that needs ₹25 lakh to diversify won't behave the same on ₹2 lakh.
- The seller can say how the backtest was built: how many variations were tried, which period was held back for testing, and what costs were assumed.
If a seller can't or won't answer these, treat that as the answer.
What are the warning signs?
Some claims should end the conversation. Walk away from any product that promises guaranteed or fixed monthly returns, or "no losing months". Be wary of win rates of 90% or more quoted without the size of the losses (a strategy that wins small 95% of the time and loses big the other 5% is a well-worn way to empty an account). The same goes for logic that's "proprietary" and can never be described, backtest screenshots with no live statements, and countdown timers on the price. (A real edge rarely comes with a sale that ends at midnight.)
These aren't hypothetical. In January 2024 the US Commodity Futures Trading Commission issued an advisory titled "AI Won't Turn Trading Bots into Money Machines". One case it cited was a bot programme that promised monthly returns of 10% or more and took about $1.7 billion in bitcoin from at least 23,000 people. It turned out to be a Ponzi scheme.
Buy or build?
For many traders the real question isn't which algorithm to buy but whether to buy at all. Notice that every item on the checklist above, from reading a track record to asking how a backtest was built, is a skill you'd also use to build your own strategy. We look at that choice in our article on managed services versus building your own. The checklist is worth learning either way, because it's the same one you'd apply to your own backtests.
Frequently asked questions
Is it worth buying a trading bot?
It can be, if you can verify a live track record net of costs, understand what the strategy does and accept its drawdowns. Many bots are sold mainly on backtests, which are a weak guide: in one study of 888 strategies, backtest Sharpe explained less than 2.5% of the variation in out-of-sample Sharpe.
How do I verify a seller's track record?
Ask for broker statements or a third-party verified record covering at least a year of live trading, with commissions and slippage included. Compare the live results with the backtest for the same period. If live performance is much weaker, the backtest was probably overfitted.
Why would someone sell a profitable trading algorithm instead of using it?
Selling a strategy to many users tends to erode its edge, so a seller with a real, scalable edge usually earns more by trading it. There are legitimate reasons to sell (limited capital, a market the seller doesn't trade, a software business), but ask the question before you pay.
Are algo strategies sold in India regulated?
Under SEBI's retail algo framework, providers offering algos through brokers must be empanelled with the exchanges, and black-box algo providers must also register as SEBI research analysts. That's a minimum check, not evidence that a strategy will make money.
Key points
- A bought algorithm can make money, but expect less than advertised: sellers usually show the best of many backtests, and shared edges shrink.
- In our Nifty test, the best of 449 moving-average rules went from a Sharpe ratio of 0.95 in the backtest to 0.20 on data it hadn't seen.
- Ask for a live, cost-inclusive record, the worst drawdown, an outline of the logic and the number of variations tested.
- Any promise of fixed returns or no losing months is a reason to walk away.
If you'd like to run a test like the 449-rule experiment on your own ideas, Quantra's self-paced backtesting courses walk you through it step by step. QuantInsti's Executive Programme in Algorithmic Trading (EPAT) goes further into strategy design, validation and risk management, which is the toolkit for judging any algorithm on its evidence rather than its sales page.
Sources: Wiecki, Campbell, Lent and Stauth (2016), "All That Glitters Is Not Gold", Journal of Investing 25(3). Bailey, Borwein, López de Prado and Zhu (2014), "Pseudo-Mathematics and Financial Charlatanism", Notices of the AMS 61(5). McLean and Pontiff (2016), "Does Academic Research Destroy Stock Return Predictability?", Journal of Finance 71(1). Bailey and López de Prado (2014), "The Deflated Sharpe Ratio", Journal of Portfolio Management 40(5). SEBI circular on safer participation of retail investors in algorithmic trading, 4 February 2025, and timeline circular of 30 September 2025. SEBI press release 20/2022, 10 June 2022. CFTC customer advisory, 25 January 2024. Nifty 50 test: Yahoo Finance daily closes, September 2007 to September 2026 (2007 and 2008 used only to warm up the moving averages), our calculations; Sharpe ratios computed without deducting a risk-free rate.
Interested in algorithmic trading?
Connect with an EPAT career counsellor to create a personalised quant career path for you