By QuantInsti
This is the blog of a project that blends practical market experience with algorithmic thinking. Chytil Mario, a former energy trader and now a data science enthusiast, took on the challenge of building a mid-frequency trading strategy from the ground up. His EPAT final project is not just another academic exercise; it’s a window into how someone with domain knowledge, curiosity, and rigorous self-preparation can create a structured, ML-powered trading tool grounded in real-world logic.
The project focuses on Brent Oil Futures and brings together candlestick pattern recognition, technical indicators, volume confirmations, and machine learning.
The result?
A framework that doesn't just chase trades, but attempts to understand the 'why' behind them. This blog walks through that journey, the idea, the execution, the challenges, and the promise of what it can evolve into.
About the Author
Chytil Mario began his professional journey as an energy trader before transitioning into energy sales and consulting, where data analysis was a core part of the role. With time, he developed a keen interest in the potential of data science and pursued further studies in Data Science and Business Analytics. While exploring areas like financial trading design and technology, he remained connected to financial markets.
"Trading was always in my mind, it was my profession. But with the rise of data, I saw the need to upskill. That’s when I moved into data science and found my way to algorithmic trading."
Mario first connected with QuantInsti in 2019–2020 and continued to follow its educational content until he formally enrolled in EPAT during the summer of 2024. His preparation included a year-long self-learning journey in Python (after having previously worked in R), allowing him to make the most out of the EPAT experience.
Project Abstract
The aim of this project is to develop an effective, hence complex, real-life implementation-ready Python-coded trading tool based on candlestick pattern recognition and Machine Learning supported prediction of market direction, which uses technical indicators as input features.
"This was not just a study project for me; it was about integrating all I had learned into something real-world ready."
My view is that, although a separate deployment of these components might not be sufficient to overcome the market’s challenges, an out-of-the-box approach to integrate them into one system could result in a solution to serve profitable trend-reversal trading strategy(ies). As the interpretation of the model cannot be captured with a simplified strategy description, a separate flowchart is also included. (See Figure No. 1.)
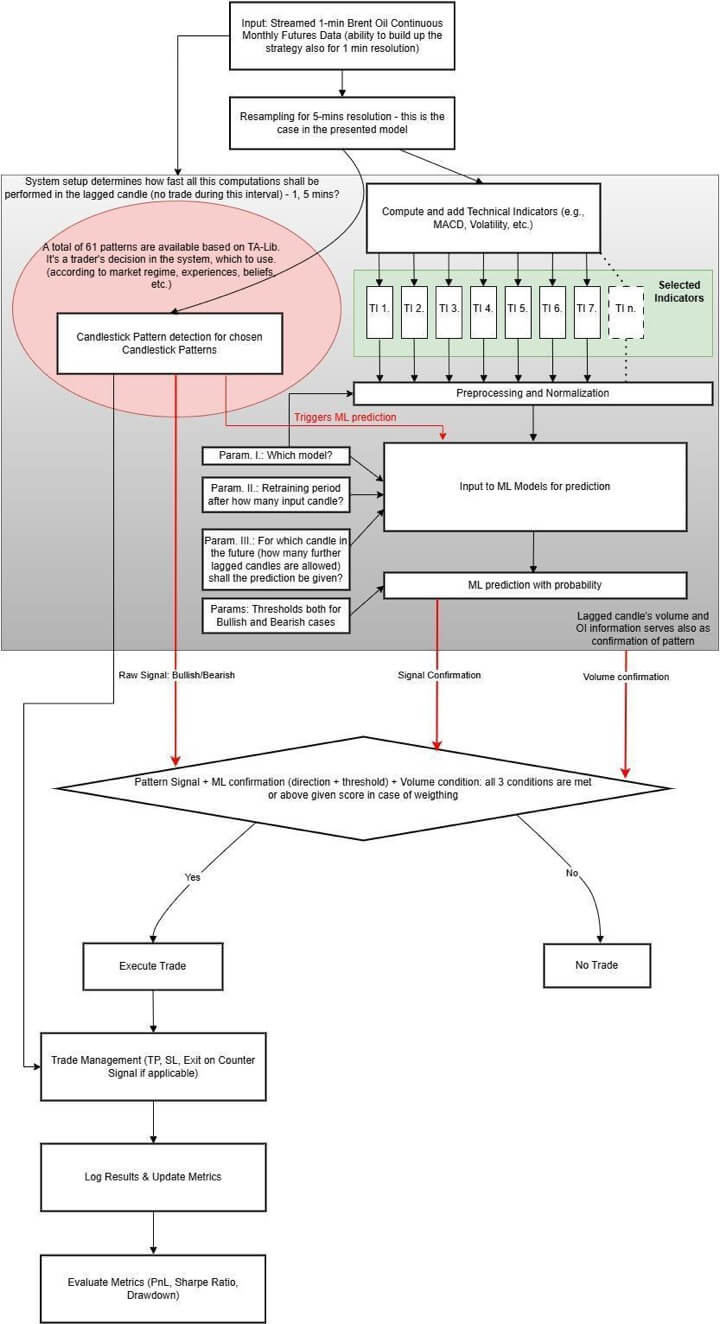
As represented in the above chart, the project’s focus is on entry logic, which is as per follows:
- As an input parameter, it shall be defined which candlestick pattern(s) will be detected by TA-Lib in the incoming data feed (real-life application) or, in the case of past data, for the event-driven backtesting. This can vary from 1 (for example, “Hammer”) to 61, which means that all candlestick patterns coded in TA-Lib will be detected by the model.
Detecting is meant in the sense that, if there is/are a specific Japanese candlestick pattern(s) formed in the data, which was/were previously set as input parameter to be "watched – then a +1 (Bullish) or -1 (Bearish) signal is given by the model.
I do not call it an entry signal, rather an entry condition, as two other conditions are also necessary for entry, which are described in the next two paragraphs in this section. For this description and project presentation, I used 5 patterns to detect, namely Matching_Low, Inverted_Hammer, Three_Inside_Up_Down, Hammer, and Gravestone_Doji. As a consequence, results for these 5 patterns are shown in Key Findings. As these patterns are identified as trend-reversal indicators by articles about TA-Lib, (see Bibliography). I call my strategy described here a trend-reversal strategy(ies).
- The second entry condition is a market direction prediction calculated by the Machine Learning model. To align with the candlestick conditions, this can also be +1 (Bullish) or -1 (Bearish). These figures come with a probability and are only considered if they exceed a certain user-defined probability threshold.
- The third entry condition is a confirmation of volume increase.
"You need a candlestick pattern, ML prediction, and a volume signal to align, only then a trade is executed. This three-legged entry is the core of my system."
The entry happens only if there is a candlestick pattern-based signal, (+1 or -1) and an ML-based signal (+1 or -1, but it shall indicate the same direction as the candlestick-based condition) and there is also a volume increase confirmation.
This entry condition holds for each candlestick pattern defined as input, as they are handled as separate streams in the model/project, (objects of the same class in OOP terms, meaning that, each pattern's recognition, trade execution, TP/SL optimisation, analytics calculation, and visualisation is managed through a unique object of the base class CandlestickPatternBase in the code) having separate P&Ls, Sharpes, and Drawdowns at the end. In summary, the model elaborated in the project work, in its presented current form captures 5 separate trend-reversal strategies.
Project Motivation
The project motivation was to develop a mid-frequency trading tool which combines, in a meaningful way, different techniques to determine bullish and bearish entry signals such as candlestick pattern recognition, technical indicators, volume confirmation, and ML models for prediction of market’s direction for (energy) commodities, more specifically for Brent Oil Monthly Futures.
"My background is in power and gas markets across Europe, and while those markets are slightly different, many of the underlying instruments are quite similar to financial markets. This project was a way for me to converge both worlds."
At this initial stage, the project focused more on entry signals. By the end of the project, it has been confirmed, that there do exist a few trend-reversal indicating candlestick pattern(s), which showed positive results by experimenting on individual Futures Contract(s), and, as an obvious consequence these results can also be displayed on a Futures Continuous Product achieved by the stitching together of individual (sequential) Contracts’ data.
This description presents these results with an emphasis on entry signals and highlights that, for profitable trades including transaction costs, an exit optimisation is also necessary, based on my experiences.
Data Mining
This part of the project is based on 1-minute data gathering, which shall stream data in a live environment and fetch historical data for backtesting purposes. Both methods are supported by the necessary utility functions such as authenticate(), reauthenticate(), fetch_historical_data(), etc.
Special emphasis is placed on the resample() function, which transforms 1-minute candles into 5-minute candles and generates the final output of the data feed step, and sets the resolution at which the system operates. From this point onward, every step in the model, including pattern recognition, Machine Learning, and volume confirmation, operates on a 5-minute timeframe.
Lagged Signal Design
Another important feature of the project is the introduction of the lagged signal concept, meaning that entry does not occur immediately after the detection of a Japanese candlestick formation. Instead, there is a 5-minute delay, in other words, the system waits for one additional candlestick, which represents a 5-minute interval.
"This lag gives the ML model time to retrain if needed and lets me verify volume dynamics. It adds stability."
This delay exists for two key reasons:
- From a time dimension perspective, the developed model allows for dynamic retraining of the Machine Learning algorithm based on newly incoming data. In the case of certain models - such as Random Forests or neural networks - the required computation time can be unpredictable. Therefore, a fixed 5-minute delay is built into the system. During this period, if the user has enabled dynamic retraining, the new data (often including many 5-minute bars) is processed, and the model outputs a market direction prediction (bullish or bearish) along with a probability. This prediction serves as a confirmation of the candlestick-based signal.
- From a data (or trading) dimension perspective, this additional 5-minute candle provides further information - aggregated from five 1-minute candles - which includes volume data. This volume is used as the third condition for entry: recall that a trade can only be executed if there is also a volume increase. The volume from this lagged candlestick is thus used to confirm (the beginning of a) momentum before entering the trade.
All of the above can be illustrated with an example: a candlestick pattern is detected on a candle with a time interval starting at 9:30 and ending at 9:35 on a specific day. The next candle, with a time interval between 9:35 and 9:40, is used for volume confirmation. During this same interval, the necessary Machine Learning calculations are also carried out if this feature is set by the user (this candle is named later, due to the concept, as lagged candle).
Data Analysis
Once the system resamples the input data from 1-minute to 5-minute, based on the coming Open, High, Low, and Close prices, candlestick patterns from TA-Lib are identified. As the project in its presented form supports trend-reversal trading strategy(ies), only those patterns are involved in the detection, which have been previously set as input parameters and have trend-reversal implications from the total of 61 available patterns.
The consideration behind trend-reversal usage is my approach to recognizing the trend right after its formation (however, commodities are usually traded also with trend continuation and not only with trend-reversal, here comes the trader’s discretion into play to choose which patterns to allow into the system, based on prior domain experience and interpretability).
"I didn’t just want to rely on Yahoo Finance data dumps, I wanted my data gathering process to feel like it could run live, at a prop desk or institution. That’s why I pushed myself to integrate API calls and 1-minute streaming inputs."
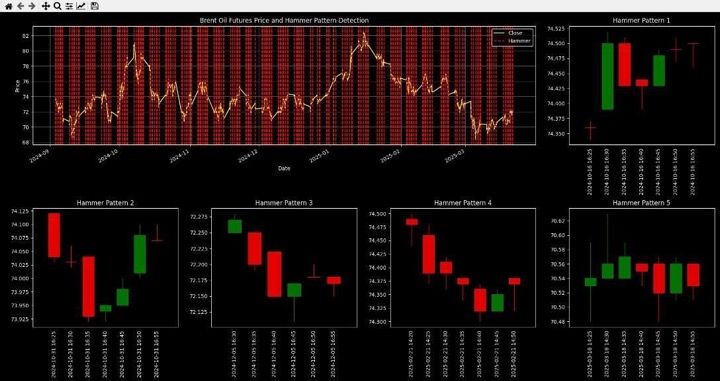
Due to computational time constraints and length restrictions of this description, only 5 patterns are further examined in detail (Matching_Low, Inverted_Hammer, Three_Inside_Up_Down, Hammer, Gravestone_Doji as indicated also in the Project Abstract’s section) all of them supporting a trend-reversal strategy. Hence, raw candlestick signals are frequent and often noisy in lower-timeframe environment, as Figure No. 2 shows for Hammer formation, further signal filtering and volume confirmation are crucial components of the strategy, as the data flow diagram demonstrates in Figure No. 1.
Parallel to candlestick pattern detection, different technical indicators (e.g., Volatility, MACD, etc.) are computed for each candle, which serve as input features to the Machine Learning prediction models after preprocessing and normalisation. The ML pipeline for prediction is triggered, when a candlestick pattern is detected (if set by the user, model retraining happens after each 40 candles, which is an adjustable parameter).
At this point, the model predicts the future market direction using the previously normalised technical indicator features, which validate the direction indicated by the candlestick pattern(s). The ML pipeline is customisable through:
- Model choice (Random Forest in this project).
- Retraining settings (retrain frequency, after how many candles retraining happens; which is 40 in this project).
- Lookahead setting, which is the number of candles into the future or future window for which the prediction for the market’s direction is made (this is 4 candles in this project).
- Thresholds for bullish and bearish signal acceptance (The prediction for the market’s direction is given with probability; prediction is only considered if it is above or below a certain threshold for Bullish or Bearish market).
The model is trained on input features, with the return direction (positive or negative) as the target, and uses this to classify whether the market is likely to go up or down over a future window. In this way, it effectively captures short-term market direction. The presented ML component acts as a filter or confirmation for raw candlestick signals, aiming to reduce false positives and increase trade conviction.
Volume data (from the lagged candle) is used as an additional verification layer to validate the momentum behind a pattern signal. This is especially vital in Commodity Futures like Brent Oil, where volume increase often precede significant directional moves. By volume increase, I mean that the lagged candle’s volume (i.e., the one immediately after the pattern) should be higher than the volume of the candle in which the candlestick pattern was detected.
Trade decisions are made only when all three components align:
- A candlestick pattern with bullish/bearish implications,
- A confirming ML prediction above a configured probability threshold,
- A volume increase condition.
If entry criteria are met, a trade is executed. (long or short, depending on signal direction). For Trade Management, simple Take Profit and Stop Loss criteria are implemented. In the strategy, the counter signal of the same pattern might also be used for exiting the position (supposing that predicts a trend-reversal against the current trend). To produce real-life profitable trades, these exit conditions must be further optimised. All trades are logged, and performance metrics are calculated and updated, including:
- Profit and Loss (P&L) metrics,
- Sharpe, Sortino Ratio,
- Maximum Drawdown.
Key Findings
Results of the entry-focused (on exit side not optimised) trend-reversal trading strategies by (candlestick) patterns supported with Random Forest ML model (with above described parameters) are shown in Figure No. 3.
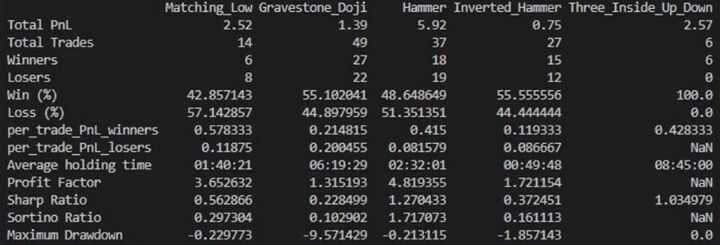
Results of a trend-reversal strategies (candlestick patterns + ML model-based prediction for direction):
Favourable performance metrics for Hammer and Three_Inside_Up_Down patterns. All P&L figures are expressed on a per-barrel basis in USD. Since one contract represents 1.000 barrels, the figures should be multiplied by 1.000 to obtain contract-level results. Average holding time is expressed in hours.
"These results are promising, but the exit strategy is simple right now. I’m working on that next."
Challenges/Limitations
- All the above calculations refer to the outcome of trading with one theoretical unit of one barrel (as trading also has this magnitude). The real trading lot size is 1000 units (barrels).
- It shall be also considered by the above final analysis in Key Findings section, that the trading interval, when the model operates, is only 8 months (approximately 160 active trading days) by creating a Futures Continuation Contract. Daily price fluctuations usually remain below $1, and the total price fluctuation over the entire period is less than $15. Results shall be interpreted against these figures.
- In its current form (operating with Brent Oil Futures), the system is not designed for retail traders due to financial and administrative constraints. For example, at least in some countries, special permissions and exams are required to trade futures. My reason for choosing this underlying asset is due to my strong interest in energy markets.
- Due to high transaction fees, it is generally recommended to use a more favorable method of accessing the exchange rather than relying on a broker account. I could only incorporate the fees applied to my account into the model, which makes no sense because of the described financial and administrative obstacles. As a result, transaction fees are not accounted for in the tool's current form.
- To narrow the almost infinite range of possibilities, domain knowledge (e.g., in oil, metals, or equities) should be applied when selecting patterns, technical indicators, and TI’s parameters. This approach can help achieve improved trade-level and performance metrics. ("Commodities are traded with knowledge.")
Implementation Methodology (if live/practical project)
The strategy/model code is implemented across multiple files with a .py extension. Due to its complexity, setting up a separate virtual machine (VM) is recommended. Environment configuration should be performed using a dedicated .yml file, as the project (including ML, plotting, etc.) is sensitive to specific libraries and their corresponding versions (Some version conflicts need to be resolved manually).
The data feed is managed through a broker’s API, where subscribing to a Futures Continuous Contract is recommended to avoid switching the Contract IDs within the code. The entire codebase has been developed following the Object-Oriented Programming (OOP) paradigm.
Conclusion:
This project does not seek to "beat the market" through brute force ML or isolated techniques. Still, it aims to provide a comprehensive, adaptive strategy to detect trend-reversals where classical candlestick pattern and technical analysis meets modern ML-driven validation. The result is a mid-frequency, candlestick-based, ML-confirmed, and volume-aware trading engine purpose-built for the dynamic nature of Brent Oil Futures.
"This is now more than a study project; I continue to improve it. Maybe one day, it becomes a deployable product."
Annexure/Codes
The code for this project has been withheld at the author's request.
Bibliography
- Sklarew, A. (1980). Techniques of a professional commodity chart analyst. Commodity Research Bureau.
- Nison, S. (1991). Japanese candlestick charting techniques. New York Institute of Finance.
- Raj, T. K. (2020, January 24). Intraday low-frequency trading strategy. QuantInsti Blog. https://blog.quantinsti.com/intraday-low-frequency-trading-strategy-project-rajtk/
- Thakar, C., & Bhagat, V. (2024, September 9). Candlestick patterns: How to read charts, trading, and more. QuantInsti Blog. https://blog.quantinsti.com/candlestick-patterns-meaning/
- QuantInsti. (n.d.). Candlestick patterns-based automated trading [Online course]. Quantra. https://quantra.quantinsti.com/course/candlestick-patterns-automated-trading
- Malato, G. (2020, November 3). How to identify Japanese candlesticks patterns in Python. TDS Archive. https://medium.com/data-science/how-to-identify-japanese-candlesticks-patterns-in-python-b835d1cc72f7
- QuantInsti. (2021, January 4). Futures continuation: What it is, challenges, methods and more. QuantInsti Blog. https://blog.quantinsti.com/continuous-futures-contract/
- Data2Wealth. (2021, August 24). Which is the best candlestick pattern? (1). Medium. https://data2wealth.medium.com/does-candlestick-patterns-worth-study-my-new-python-project-will-help-find-out-b4c526613d47
- Data2Wealth. (2022, February 27). Which is the best candlestick pattern? (2). Medium. https://data2wealth.medium.com/do-candlestick-patterns-worth-study-my-new-python-project-will-find-out-2-afefc38dfd50
- Kulkarni, A. (2024, August 25). A guide to identifying candlestick patterns in Python using Ta-Lib and custom formulas. Stackademic. https://blog.stackademic.com/a-guide-to-identifying-candlestick-patterns-in-python-using-ta-lib-and-custom-formulas-1b6ff4b0670f
- Velasquez, C. (2024, February 5). Automating 61 candlestick trading patterns in Python. Medium. https://medium.com/@crisvelasquez/automating-61-candlestick-trading-patterns-in-python-f28709c50684
- Francis, Z. (2024, July 21). How to trade candles: A full strategy backtest in Python. Medium. https://wire.insiderfinance.io/doji-vs-engulfing-candles-a-full-python-strategy-backtest-6c2dadb38156
Next steps
To build on the concepts covered in this blog, such as machine learning classification, candlestick pattern recognition, volume confirmation, and mid-frequency strategy development, you can explore advanced resources and structured learning paths that focus on machine learning in trading.
Start with foundational application guides like Machine Learning for Algorithmic Trading in Python: A Complete Guide and Artificial Intelligence & Machine Learning in Trading, which walk through how predictive models are built and evaluated in live financial contexts.
For those looking to go beyond supervised models, An Introduction to Unsupervised Learning for Trading is ideal for clustering-based techniques, while Reinforcement Learning in Finance offers insight into learning strategies that adapt over time and across market regimes.
To further strengthen your modelling and evaluation skills, refer to Machine Learning Classification: Concepts, Models, Algorithms and More and Machine Learning Logistic Regression: Python, Trading and More. These resources offer focused guidance on the types of models Mario used in his EPAT project.
You can also download the Machine Learning in Trading Book to gain deeper theoretical insights and practical case studies.
If you’re ready for hands-on learning with industry guidance, explore the Machine Learning & Deep Learning in Trading – Beginners Track, and the more advanced AI in Trading Learning Track. These curated paths offer end-to-end training from data handling and feature engineering to model deployment.
For strategy deployment in specific asset classes, the Algorithmic Trading in Cryptocurrency and Forex track can be highly useful.
Finally, if you’re inspired by Mario’s structured approach and want to replicate a similar end-to-end project, consider the Executive Programme in Algorithmic Trading (EPAT). It provides a comprehensive curriculum covering Python, statistics, machine learning, backtesting, and real-world trading applications, all essential components behind Mario’s EPAT final project.
Disclaimer:The information in this project is true and complete to the best of our Student’s knowledge. All recommendations are made without guarantee on the part of the student or QuantInsti®. The student and QuantInsti® disclaim any liability in connection with the use of this information. All content provided in this project is for informational purposes only and we do not guarantee that by using the guidance you will derive a certain profit.
Schedule an EPAT counselling call
To understand if EPAT is the right choice for you, talk to one of our specialists who have counselled thousands of learners over the past decade and helped them make the right career decision.