
This blog covers in brief the concept of strategy back-testing using R. Before dwelling into the trading jargons using R let us spend some time understanding what R is. R is an open source. There are more than 4000 add-on packages,18000 plus members of LinkedIn’s group and close to 80 R Meetup groups currently in existence. It is a perfect tool, for statistical analysis, especially for data analysis. The concise setup of Comprehensive R Archive Network knows as CRAN provides a list of packages along with the base installation required. There are a lot of packages available depending upon the analysis needs to be done. To implement the trading strategy, we will use the package called quantstrat.
Four Step Process of Any Basic Trading Strategy
- Hypothesis formation
- Testing
- Refining
- Production
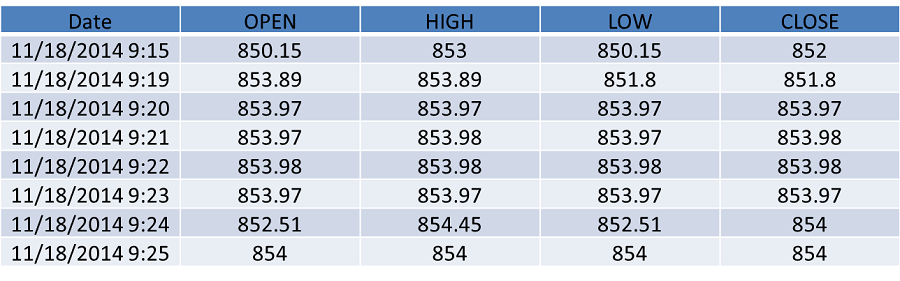
Our hypothesis is formulated as “market is mean reverting”. Mean reversion trading is a theory that suggests that the prices eventually move back to their average value. The second step involves testing the hypothesis for which we formulate a strategy on our hypothesis and compute indicators, signals and performance metrics. The testing phase can be broken down into three steps, getting the data, writing the strategy and analyzing the output. In this example we consider NIFTY-Bees. It is an exchange traded fund managed by Goldman Sachs. NSE has huge volume for the instrument hence we consider this. The image below shows the Open-High-Low-Close price of the same.
We plot the Bollinger band for the closing price.

We set a threshold level to compare the fluctuations in the price. If the price increases/decreases, we update the threshold column. The closing price is compared with the upper band and with the lower band. When the upper band is crossed, it is a signal for sell. Similarly, when the lower band is crossed, it is a buy signal. The coding section can be summarized as follows:-
- Adding indicators
- Adding signals
- Adding rules
A helicopter view towards the output of the strategy is given in the diagram below.
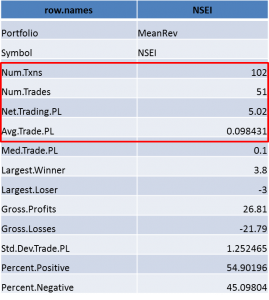
Thus our hypothesis that market is mean reverting is supported. Since this is back-testing we have room for refining the trading parameters that would improve our average returns and the profits realized. This can be done by setting different threshold levels, more strict entry rules, stop loss etc. One could choose more data for back-testing, use Bayseian approach for the threshold set up, take volatility into account.
Once you are confident about the trading strategy backed by the back-testing results you could step into live trading. The Production environment is a big topic in itself and it’s out of scope in the article’s context. To explain in brief this would involve writing the strategy on a trading platform.
Webinar Video
Next Step
Once you've learned basics of designing a quant trading strategy using R, you can take a look at an example of trading strategy coded in R and also learn about how to get started with quantmod package in R. You can also take a look at our interactive self-paced 10 hours long datacamp course 'Model a Quantitative Trading Strategy in R'

