By Ishan Shah
The Turtle Trading system was coined by Richard Dennis and worked brilliantly for the traders in the 1980’s. But it turns out that the system requires some tweaking for it to reflect new market conditions and be effective now. That said, trends still happen which means there are a plethora of trading opportunities.
The core of the turtle trading strategy is to take a position on futures on a 55-day breakout. A 55-day breakout is when the price exceeds high or low of past 55 days price. The full strategy is more complex, however in this article, I have coded the crux of the strategy in Python and traded on stocks such as Apple Inc., Kinder Morgan Inc., and Ford Motor Company.
Python Code
Step 1: Import the necessary libraries
# To get closing price data
from pandas_datareader import data as pdr
import yfinance as yf
yf.pdr_override()

# Plotting graphs
import matplotlib.pyplot as plt
import seaborn

# Data manipulation
import numpy as np
import pandas as pd
Step 2: Define a function to calculate the strategy performance on a stock
- We will pass the ticker symbol of Apple, Kinder Morgan and Ford Motor to this function.
def strategy_performance(stock_ticker):
- Get the data for the stock_ticker from yahoo finance
stock = pdr.get_data_yahoo(stock_ticker, start="2009-01-01", end="2017-10-01")
- Compute 5-days breakout and mean
A past 5-days high, low and mean values are computed and stored in data frame stock. 5 is the free parameter which is to be optimized in backtesting. The pandas rolling function is used to calculate the breakout and mean.
# 5-days high
 stock['high'] = stock.Close.shift(1).rolling(window=5).max()
 # 5-days low
 stock['low'] = stock.Close.shift(1).rolling(window=5).min()
 # 5-days mean
 stock['avg'] = stock.Close.shift(1).rolling(window=5).mean()
- Entry Rules
When the closing price of the stock is greater than the high of past 55 days then we go long on the stock and when the closing price of the stock is less than the low of past 55 days then we go short on the stock.
stock['long_entry'] = stock.Close > stock.high
stock['short_entry'] = stock.Close < stock.low
- Exit Rules
We will exit the positions if the stock price crosses the mean of the past 55 days.
stock['long_exit'] = stock.Close < stock.avg
stock['short_exit'] = stock.Close > stock.avg
- Positions
We will now store the entry and exit signal in a single column. The long position is indicated by 1, the short position is indicated by -1 and exit or no position is indicated by 0. We will carry forward the previous position if no position exists for a time period using the fillna method.
stock['positions_long'] = np.nan
stock.loc[stock.long_entry,'positions_long']= 1
stock.loc[stock.long_exit,'positions_long']= 0

stock['positions_short'] = np.nan
stock.loc[stock.short_entry,'positions_short']= -1
stock.loc[stock.short_exit,'positions_short']= 0

stock['Signal'] = stock.positions_long + stock.positions_short

stock = stock.fillna(method='ffill')
- Strategy Returns
We have computed the log returns of the stock and multiplied with the Signal (1,-1 or 0) to get the strategy returns.
daily_log_returns = np.log(stock.Close/stock.Close.shift(1))
 daily_log_returns = daily_log_returns * stock.Signal.shift(1)

 # Plot the distribution of 'daily_log_returns'
 print(stock_ticker)
 daily_log_returns.hist(bins=50)
 plt.show()
 return daily_log_returns.cumsum()
Histogram of daily log returns
Apple Inc.

Kinder Morgan

Ford Motor

Step 3: Create a portfolio of stocks and calculate the strategy performance for each stock
portfolio = ['AAPL','KMI','F']
cum_daily_return = pd.DataFrame()
for stock in portfolio:
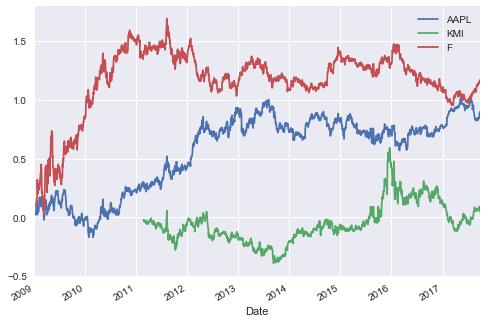
cum_daily_return[stock] = strategy_performance(stock) # Plot the cumulative daily returns
print("Cumulative Daily Returns")
cum_daily_return.plot()
# Show the plot
plt.show()
Conclusion
If you want to modify the strategy then you can copy this code and it should be pretty simple from there. You can add more stocks in the portfolio and evaluate the strategy performance on those stocks.
One of the limitations of the results is that it does not include transaction cost. It's also important to understand that the above strategy involves a good deal of risk. You're buying or selling a stock based on recent buying or selling by other market participants.
This article on Quantitative Value Investing Strategy In Python combines the best aspects of value and quantitative investing and applies them to a completely unique approach to screen stock for investing.
Update - We have noticed that some users are facing challenges while downloading the market data from Yahoo and Google Finance platforms. In case you are looking for an alternative source for market data, you can use Quandl for the same.
Disclaimer: All investments and trading in the stock market involve risk. Any decisions to place trades in the financial markets, including trading in stock or options or other financial instruments is a personal decision that should only be made after thorough research, including a personal risk and financial assessment and the engagement of professional assistance to the extent you believe necessary. The trading strategies or related information mentioned in this article is for informational purposes only.
File in the download: Turtle Trading - Python Code