

We have already discussed about Candlestick Trading Strategy in a previous article. If you missed it, just click here to read it. Many techniques are used to understand the behavior of financial markets. Many who use candlestick strategy often agree unanimously that using this particular strategy in isolation might not be beneficial. Candlestick techniques help in evaluating opportunities more efficiently as compared to the one where historical data on bar graph is used for evaluation.
Why?
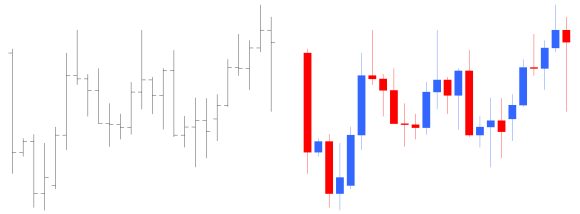
Figure 1 - Bar vs Candlestick
Clearly, trading candlestick patterns approach gives a lucid graphic presentation of data as compared to a simple bar chart. This helps traders to respond quickly to changes in the market.
In this article, we will be talking about Pivot Point.
What is Pivot Point?
Floor traders used Pivot Points to set key levels while dealing in fast moving environments. They calculated Pivot points for the day by looking at the previous day’s high, low and closing prices.
“A pivot point is a technical analysis indicator used to determine the overall trend of the market over different time frames. The pivot point itself is simply the average of the high, low and closing prices from the previous trading day. On the subsequent day, trading above the pivot point is thought to indicate ongoing bullish sentiment, while trading below the pivot point indicates bearish sentiment” [1]
Pivot points are used strategically to catch support and resistance points, thus, helping in identifying areas where reversal of price movement is possible. Pivot points are used to determine where reversals might take place and the trader can ideate their investment strategy that has higher probability of hitting the bull’s eye. Using pivot point calculation, we can consider trade entry or exit. As a rule of thumb; trading above P is a bearish, and below P is bullish (where P is the pivot point). Regardless of which level you choose, both are indicators of major price movement. Let us now take a look at how we arrive at this P.
Calculating Pivot Points
Calculation of pivot point can be performed by a few methods however; we are going to stick to the 5-Point system which uses the following parameters:
- Previous Day’s High (H)
- Previous day’s Low (L)
- Previous day’s Close (C)
- 2 Support Levels (S1 and S2)
- 2 Resistance Levels (R1 and R2)
Since this equation will have the above mentioned 5 price points, therefore it is called 5-Point system.
To calculate P, we equate:
R2 = P + (H - L) = P + (R1 - S1)
R1 = (P x 2) - L
P = (H + L + C) / 3
S1 = (P x 2) - H
S2 = P - (H - L) = P - (R1 - S1)
Say for example, I am looking at the Sensex charts for the month of September 2016.
Then,
H = 29,077.28
L = 27,716.78
C = 27,865.96
P = (H + L + C) / 3 = 28220.0067
Similarly, we put the values of P, H, L & C in our other equations and find values of :
R1 = 28723.2333
R2 = 29580.5067
S1 = 27362.7333
S2 = 26859.5067
Time Frames in Pivot Points
Prior Day
We will look at the prior day’s numbers when we have to calculate pivot points for a time frame of 1, 5, 10 & 15 minutes. So, we will be basing our intraday charts on the previous day’s H, L and C. The value of P, once set, remains constant for that day.
Prior Week
We will look at the prior week’s numbers when we have to calculate pivot points for a time frame of 30 & 60 minutes. So, we will be basing our intraweek charts on the previous week’s H, L and C. The value of P, once set, remains constant for till the end of the week.
Prior Month
When we have a time frame of an entire day, then we look at the prior month’s data. So, if we want the value of P for this month (i.e. October 2016), then we will base our calculations on the H, L & C of September 2016. Like in the previous cases, the value of P will remain constant throughout the month. From the example in the previous section, we arrived at P= 28220.0067 for the month of September 2016. When the month is completed, then new value of P will be calculated on the 1st day of November.
Kindly note that the 1st day is the first trading day of the month, not necessarily the 1st of the month.

How traders use Pivot Points
The pivot point sets the general tone for price motion. A flow above P is fine and indicates power. Remember the fact that P is based on the prior period's stats. A move above the pivot point indicates strength with a goal to reach the primary resistance, R1. A smash above first resistance suggests even more strength with a goal to the second resistance level, R2.
The vice-versa is equally applicable. A move below the pivot point shows weakness with a target to S1. A break below S1 shows even more weakness.
Traders use these values to decide their course of action. If the prices come down to S1 and stay put, then may start expecting an upturn from the support level. In the same way, if the prices go up and reach R1 or any other Resistance level and break, then they may expect a decline in the making. In order to strengthen this expectation, one must also look at the indicator signal.
To conclude
The pivot point (P) acts as the primary support or resistance indicator and therefore, we predict that the price movement at this point will be highest. Trade pundits use pivot points with the following objectives:
-
Overall trend determination
Like we mentioned before, a downward movement will indicate bearish and upward movement is sign for bullish.
-
Deciding Entry & Exit
Traders decide based on the pivot point, when and where to enter or exit the market. For instance, if I see that the price is breaking at resistance level (R) then I will put a limit order to buy 500 shares. If the same trend applies to support level (S) then I will set a stop-loss.
So, you see that pivot point technique is very efficient and is useful for traders to predict market movement. But how far you succeed in capitalizing this depends on how well you can use this with other technical indicators like candlesticks.
Next step
Candlestick and Pivot Points are movement based techniques. You may also like to read about other popular algorithmic trading strategies like statistical arbitrage and news based strategies. We suggest you to go through our series on how statistics is used in trading strategies.
Since you will need to be analytical & quantitative while getting into or upgrading to algorithmic trading it is imperative to learn programming (some if not all) and build foolproof systems and execute right strategies. To enable a fine learning experience QuantInsti offers a comprehensive course called Executive Programme in Algorithmic Trading (EPAT) with lecture recordings and life time access and support.
Written by Harikumar Krishnamoorthy
Disclaimer: All investments and trading in the stock market involve risk. Any decisions to place trades in the financial markets, including trading in stock or options or other financial instruments is a personal decision that should only be made after thorough research, including a personal risk and financial assessment and the engagement of professional assistance to the extent you believe necessary. The trading strategies or related information mentioned in this article is for informational purposes only.

