
By Chainika Thakar & Vibhu Singh
Machine Learning (ML) has emerged as a powerful tool in the field of Artificial Intelligence, revolutionising various aspects of our lives. Whether it's recognising human handwriting or enabling self-driving cars, ML has become an integral part of our daily routines. With the exponential growth of data, the prevalence and importance of ML are only expected to increase in the coming years.
ML is particularly influential in key industries such as financial services, delivery, marketing, sales, and healthcare.
However, in this article, we will delve into the implementation and usage of Machine Learning in the field of trading, where its impact is significant.
ML techniques such as K-Nearest Neighbors (KNN), Support Vector Machines (SVM), Random Forests, and Neural Networks are commonly used in trading applications. These algorithms can analyse historical price data, market indicators, news sentiment, and other relevant factors to forecast future price movements and identify optimal entry and exit points.
Additionally, ML algorithms can adapt and learn from changing market conditions, continuously improving their performance. This adaptability is crucial in the dynamic and ever-evolving trading landscape, where staying ahead of the curve is essential for success.
Going further, let me ask you something regarding your trading strategy and its optimisation.
Are you seeking a groundbreaking solution to optimise your trading strategy by accurately classifying and predicting data points?
Look no further! K-Nearest Neighbors (KNN) can be used for the same.
K-Nearest Neighbors (KNN) is one of the simplest algorithms used in Machine Learning for regression and classification problems. KNN algorithms use data and classify new data points based on similarity measures (e.g. distance function).
Classification is done by a majority vote to its neighbors. The data is assigned to the class which has the nearest neighbors. As you increase the number of nearest neighbors, the value of k, accuracy might increase.
In this blog, we delve into the world of the K-Nearest Neighbors (KNN) algorithm from the machine learning domain, unveiling its potential to revolutionise your trading decisions. Brace yourself as we explore the mysteries, advantages, and potential drawbacks of this incredible tool that can elevate your trading game to new heights!
Some of the concepts covered in this blog are taken from this Quantra course on Introduction to Machine Learning for Trading. You can and learn all these concepts in detail with this course.
This blog covers:
- What is the K-Nearest Neighbors algorithm?
- How does the K-Nearest Neighbor algorithm work?
- Steps of using KNN in trading
- Step-by-step KNN in Python
- How to optimise trading strategies using KNN?
- Advantages and disadvantages of the KNN algorithm
What is the K-Nearest Neighbors algorithm?
The K-Nearest Neighbors (KNN) algorithm is a straightforward yet powerful tool in Machine Learning, commonly used for regression and classification tasks. It operates by measuring the similarity between data points using a distance function.
In classification, KNN assigns a new data point to the class that has the majority of its nearest neighbors. By adjusting the value of K, the number of nearest neighbors considered, we can impact the accuracy of the classification.
In the trading world, Machine Learning has introduced a paradigm shift, empowering traders to make data-driven decisions and enhancing their strategies. By leveraging historical data and complex algorithms, ML models can identify patterns, predict market movements, and optimise trading approaches.
One of the primary advantages of ML in trading is its ability to analyse massive amounts of data in real-time, providing traders with valuable insights and opportunities.
ML algorithms can process vast datasets, identify hidden correlations, and generate accurate stock predictions, assisting traders in making informed decisions and maximising profits.
Imagine having a group of experienced traders who guide you in making informed decisions. The KNN algorithm functions similarly by leveraging predictive analytics. It is a powerful supervised machine learning algorithm that enables you to classify and predict data points based on their proximity to the nearest neighbors in the training set.
With KNN, you can access a virtual team of expert traders, providing insights that aid in making trading choices with good expected returns.
How does the K-Nearest Neighbor algorithm work?
Imagine attending a trading conference filled with diverse market participants. To identify the most suitable trading strategy for a particular market condition, you naturally observe the behaviour of top algorithmic traders and compare it to those you already know.
The KNN algorithm operates based on a similar principle.
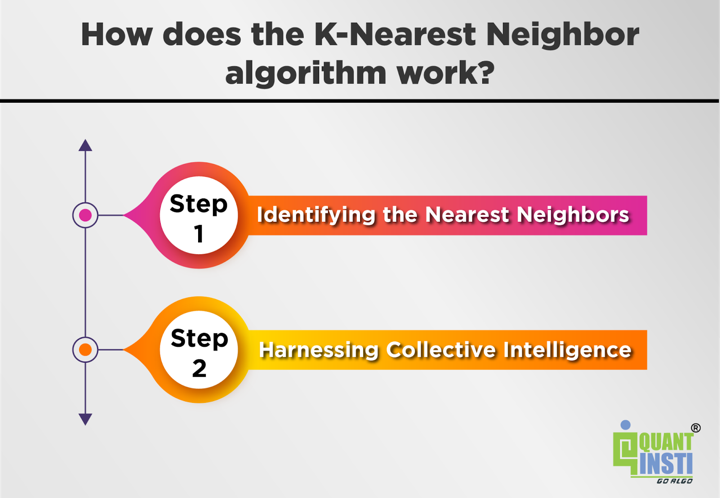
Step 1 - Identifying the Nearest Neighbors
In KNN, we locate the "k" nearest data points in the training set using a chosen distance metric, such as Euclidean or Manhattan distance. These neighbors act as decision influencers, shaping the classification or prediction of our target data point.
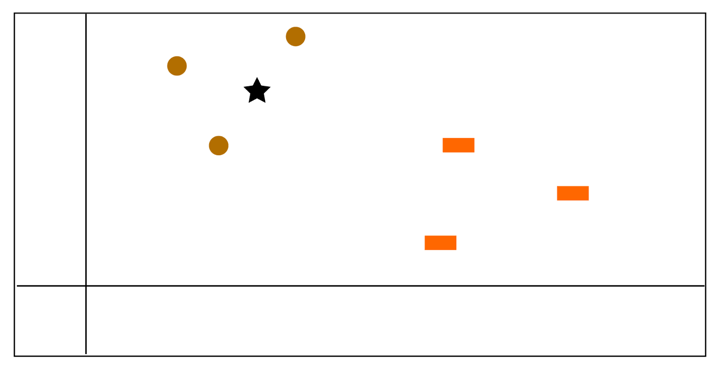
As you can see in the image below, there are three red circles and three green squares. We need to do the prediction of the target data point, i.e., the blue star. In other words, we need to find the class that blue star belongs to.
Step 2 - Harnessing Collective Intelligence
Once the nearest neighbors are identified, they contribute to a collective intelligence system by casting their votes based on their respective trading outcomes. In trading, the majority vote of successful trades determines the class or predicted outcome of the target data point.
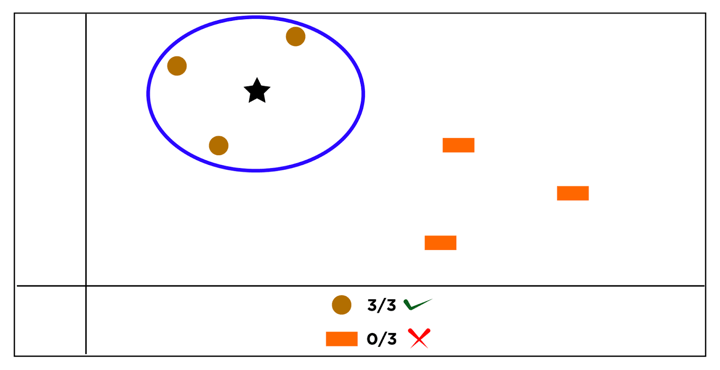
As you can see in the image below, the blue star is closest to the red circles. Henceforth, we can say that the blue star must belong to the class of red circles.
Now, let's explore how we can implement K-Nearest Neighbors (KNN) in Python to create a trading strategy.
Steps of using KNN in trading
First of all, let us see below the steps required to utilise KNN with Python and then we will head to the coding part.
Adding to the discussion, if you are new to Python, you must explore our free book on Python to cover the basics before you head to learn the same.
So, the steps in general are as follows:
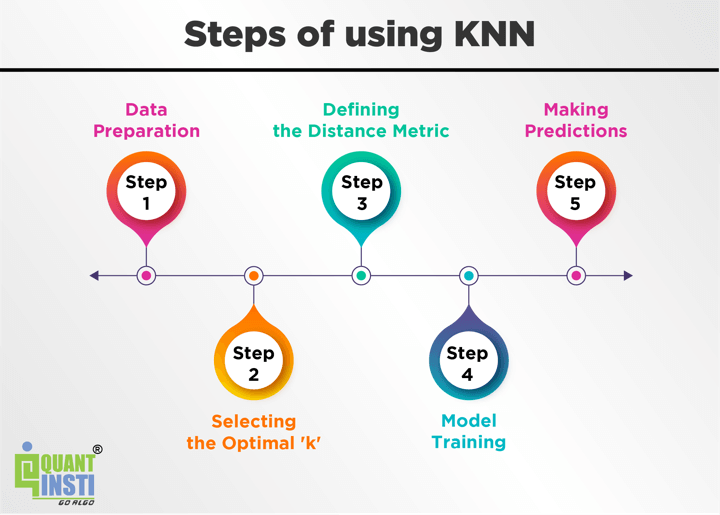
Data Preparation - Gather historical trading data and preprocess it, ensuring it aligns with the format required for KNN.
Selecting the Optimal 'k’ - Experiment with different values of 'k' to strike the right balance between bias and variance in your trading model.
Defining the Distance Metric - Choose a suitable distance metric that captures the similarity between trading patterns and behaviours.
Model Training - Fit the KNN model to your training data, allowing it to learn from historical trading patterns and outcomes.
Making Predictions - Apply the trained model to new market data, predicting the most likely trading outcomes based on the collective wisdom of similar historical data points.
Step-by-Step KNN in Python
Now, it is time for the coding part with Python. Let us go step by step.
Step 1 - Import the Libraries
We will start by importing the necessary python libraries required to implement the KNN Algorithm in Python. We will import the numpy libraries for scientific calculation. (You can learn all about numpy here and about matplotlib here).
Next, we will import the matplotlib.pyplot library for plotting the graph.
We will import two machine learning libraries:
- KNeighborsClassifier from sklearn.neighbors to implement the k-nearest neighbors vote and
- accuracyscore from sklearn.metrics for accuracy classification score.
We will also import fixyahoo_finance package to fetch data from Yahoo.
Step 2 - Fetch the data
Now, we will fetch the data using yfinance.
Output:
|
Open |
High |
Low |
Close |
|
|
Date |
||||
|
2018-01-02 |
244.071223 |
244.955144 |
243.670267 |
244.918686 |
|
2018-01-03 |
245.091811 |
246.622745 |
245.091811 |
246.467819 |
|
2018-01-04 |
247.133016 |
248.007815 |
246.531583 |
247.506607 |
|
2018-01-05 |
248.326652 |
249.283461 |
247.816350 |
249.155899 |
|
2018-01-08 |
249.055752 |
249.775653 |
248.755049 |
249.611633 |
|
... |
... |
... |
... |
... |
|
2022-12-23 |
376.806884 |
380.191351 |
375.199021 |
380.042480 |
|
2022-12-27 |
379.923398 |
380.280687 |
376.806898 |
378.543793 |
|
2022-12-28 |
378.474305 |
380.518906 |
373.601101 |
373.839294 |
|
2022-12-29 |
376.787016 |
381.471670 |
376.241117 |
380.568481 |
|
2022-12-30 |
377.789497 |
379.714941 |
375.596026 |
379.566071 |
The output above shows the OHLC data for SPY.
Step 3 - Define Predictor Variable
Predictor variable, also known as an independent variable, is used to determine the value of the target variable.
We use ‘Open-Close’ and ‘High-Low’ as predictor variables. We will drop the NaN values and store the predictor variables in ‘X’. Let us take the help of Python to define predictor variables.
You can check the code below:
Output:
|
Open-Close |
High-Low |
|
|
Date |
||
|
2018-01-02 |
-0.847463 |
1.284877 |
|
2018-01-03 |
-1.376008 |
1.530934 |
|
2018-01-04 |
-0.373591 |
1.476233 |
|
2018-01-05 |
-0.829247 |
1.467110 |
|
2018-01-08 |
-0.555881 |
1.020604 |
Step 4 - Define Target Variables
The target variable, also known as the dependent variable, is the variable whose values are to be predicted by predictor variables. In this, the target variable is whether SPY price will close up or down on the next trading day.
The logic is that if tomorrow's closing price is greater than today’s closing price, then we will buy SPY, else we will sell SPY.
We will store +1 for the buy signal and -1 for the sell signal. We will store the target variable in a variable ’Y’.
Step 5 - Split the Dataset
Now, we will split the dataset into training dataset and test dataset. We will use 70% of our data to train and the rest 30% to test. To do this, we will create a split parameter which will divide the dataframe in a 70-30 ratio.
You can change the split percentage as per choice, but it is advisable to give at least 60% data as train data for good results.
‘Xtrain’ and ‘Ytrain’ are train dataset. ‘Xtest’ and ‘Ytest’ are test dataset.
Step 6 - Instantiate KNN Model
After splitting the dataset into training and test dataset, we will instantiate k-nearest classifier. Here we are using ‘k =15’, you may vary the value of k and notice the change in result.
Next, we fit the train data by using the ‘fit’ function. Then, we will calculate the train and test accuracy by using the ‘accuracy_score’ function.
Output:
Train_data Accuracy: 0.63
Test_data Accuracy: 0.45
Here, we see that an accuracy of 45% in a test dataset which means that 45% of the time our prediction will be correct.
Step 7 - Create a trading strategy using the model
Our trading strategy is simply to buy or sell. We will predict the signal to buy or sell using the predict function. Then, we will calculate the cumulative SPY returns for the test period.
Next, we will calculate the cumulative strategy return based on the signal predicted by the model in the test dataset.
Then, we will plot the cumulative SPY returns and cumulative strategy returns and visualise the performance of the trading strategy based on the KNN Algorithm.
Output:
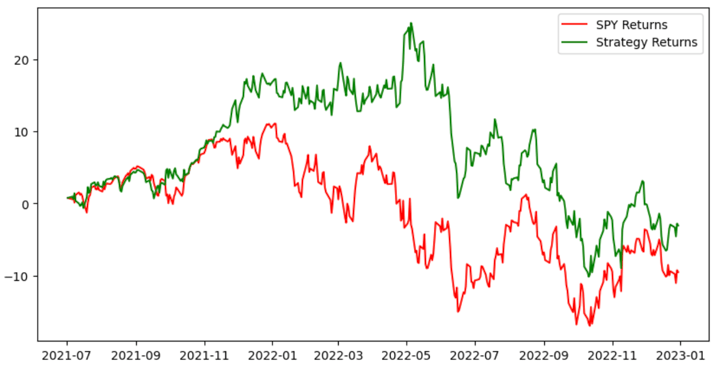
The graph above displays the cumulative returns of two elements: the SPY index and the trading strategy based on the predicted signals from the K-Nearest Neighbors (KNN) classifier.
In brief, the graph compares the performance of the SPY index(represented by the green line) with the trading strategy's cumulative returns (represented by the red line).
It allows us to assess the effectiveness of the trading strategy in generating returns compared to holding the SPY stock without active trading.
Step 8 - Sharpe Ratio
The Sharpe ratio is the return earned in excess of the market return per unit of volatility. First, we will calculate the standard deviation of the cumulative returns, and use it further to calculate the Sharpe ratio.
Output:
Sharpe ratio: 1.07
A Sharpe ratio of 1.07 indicates that the investment or strategy has generated a return that is 1.07 times greater than the per unit of risk taken.
A Sharpe ratio above 1 is typically considered good. However, it's important to compare the Sharpe ratio to other investment options or benchmarks to gain a clearer understanding of its relative performance.
Implementation of the KNN algorithm
Now, it is your turn to implement the KNN Algorithm!
You can tweak the code in the following ways.
- You can use and try the model on different dataset.
- You can create your own predictor variable using different indicators that could improve the accuracy of the model.
- You can change the value of K and play around with it.
- You can change the trading strategy as you wish.
How to optimise trading strategies using KNN?
To optimise trading strategies using the K-Nearest Neighbors (KNN) algorithm, you can follow these general steps:
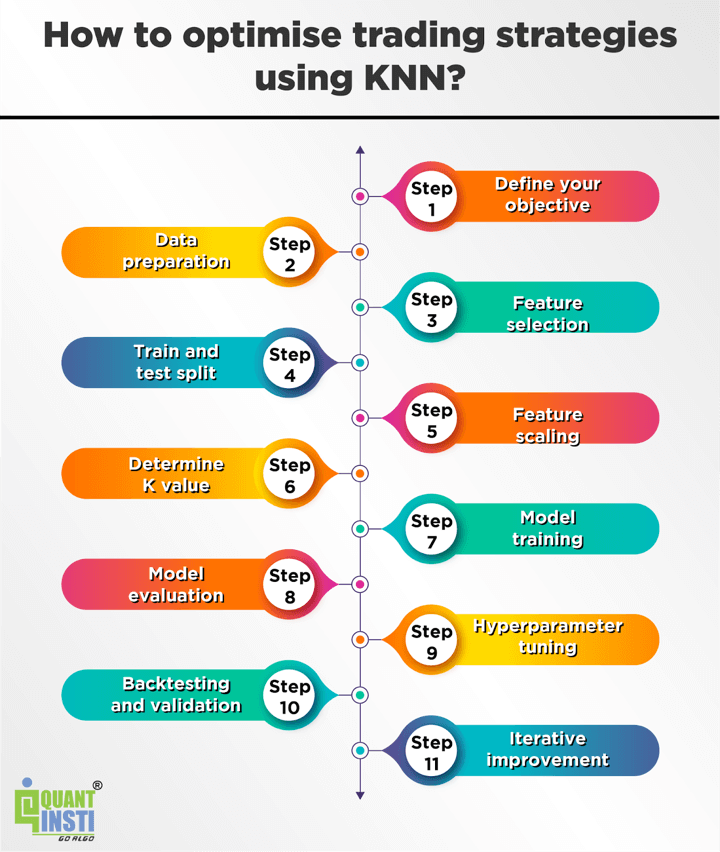
Define your objective
Clearly specify the goal of your trading strategy optimisation. Determine whether you are aiming for higher returns, risk reduction, or a specific performance metric.
Data preparation
Gather historical financial data relevant to your trading strategy. This includes price data, volume, technical indicators, and any other features that might impact your trading decisions. Ensure the data is cleaned, preprocessed, and properly formatted for input into the KNN algorithm.
Feature selection
Identify the most relevant features for your trading strategy. You can use techniques like correlation analysis, feature importance, or domain knowledge to select the most influential features that can help predict market movements or generate trading signals.
Train and test split
Split your data into training and testing datasets. The training set is used to build the KNN model, while the testing set is used to evaluate its performance. Ensure the splitting is done in a way that preserves the temporal order of the data to simulate real-time trading scenarios.
Feature scaling
Scale the selected features to ensure they are on a similar scale. As mentioned earlier, KNN is sensitive to feature scaling, so it's important to bring all features to a consistent range to avoid biases or dominance by certain features.
Determine K value
Choose an appropriate value for K, the number of nearest neighbors to consider. This value should be determined through experimentation and validation to find the optimal balance between bias and variance in the model.
Model training
Use the training dataset to fit the KNN model. The model learns by memorising the feature vectors and corresponding target variables.
Model evaluation
Evaluate the trained KNN model using the testing dataset. Measure its performance using appropriate metrics such as accuracy, precision, recall, or the Sharpe ratio.
Hyperparameter tuning
Experiment with different hyperparameters of the KNN algorithm, such as the distance metric used, to optimise the model's performance. You can use techniques like cross-validation or grid search to find the best combination of hyperparameters.
Backtesting and validation
Apply the optimised KNN model to out-of-sample or real-time data to validate its performance. Assess the profitability, risk, and other performance metrics of your trading strategy based on the generated trading signals.
Iterative improvement
Monitor the performance of your trading strategy over time and iterate on the model and strategy as needed. Continuously analyse the results, learn from mistakes, and make adjustments to improve the performance of your trading strategy.
Note: Trading strategy optimisation is a complex and iterative process. It requires a deep understanding of financial markets, robust data analysis, and continuous refinement of your approach.
Pros of using the KNN algorithm
Using KNN algorithm leads to certain advantages for the traders. Let us see below which all are the pros of using KNN algorithm.
Simplicity
KNN is easy to understand and implement. It has a straightforward intuition and does not make many assumptions about the underlying data.
Non-parametric
KNN is a non-parametric algorithm, meaning it does not assume a specific distribution of the data. It can work well with both linear and non-linear relationships in the data.
Flexibility
KNN can be used for both classification and regression tasks. It can handle multi-class classification problems without much modification.
Cons of using the KNN algorithm
Alongwith the pros come the cons of everything and KNN algorithm is no exception.
Let us find out the cons of using KNN algorithm below.
Computational complexity
KNN has a high computational complexity during the prediction phase, especially with very large datasets. Hence, it is better to break the dataset into smaller ones for training.
Sensitivity to feature scaling
KNN algorithm is sensitive to the scale of the features. If the features are not appropriately scaled, variables with larger magnitudes can dominate the distance calculations. This can be solved with techniques such as Min-Max scaling and standardisation.
Significant memory requirement
As we discussed in the first point, KNN does not work well with large datasets, you require significant memory for storing the breakdowns of the dataset.
Hence, the cons can be taken care of as mentioned for each con above.
Next step
Now that you know how to implement the KNN Algorithm in Python, you can start to learn how logistic regression works in machine learning and how you can implement the same to predict stock price movement in Python.
You can check this blog on Machine Learning Logistic Regression In Python: From Theory To Trading for learning the same.
Bibliography
- k-nearest neighbor algorithm in Python
- The k-Nearest Neighbors (kNN) Algorithm in Python
- A Complete Guide to K-Nearest Neighbors (Updated 2023)
Conclusion
The K-Nearest Neighbors algorithm is a versatile tool for classification and regression tasks. While it has its advantages, its performance greatly depends on proper parameter selection and the nature of the data. When applied thoughtfully, KNN can contribute to enhancing trading strategies.
For those interested in learning more about KNN and its applications in trading, check out the course on Machine Learning for Trading.
This course is perfect for the beginners to get started with machine learning. The course teaches how different machine learning algorithms are implemented on financial markets data. Also, with this course you will be able to go through and understand different research studies in this domain.
Note: The original post has been revamped on 11th September 2023 for accuracy, and recentness.
Disclaimer: All data and information provided in this article are for informational purposes only. QuantInsti® makes no representations as to accuracy, completeness, currentness, suitability, or validity of any information in this article and will not be liable for any errors, omissions, or delays in this information or any losses, injuries, or damages arising from its display or use. All information is provided on an as-is basis.

