

By Jay Maniar
About Japanese Candlestick Trading
It is said that Japanese used technical analysis to trade rice in the 17th century. One such rice trader from Sakata by the name Munehisa Homma is said to have developed this technique of candlestick charting to analyze the daily spot price of rice in the market. According to Steve Nison, the father of modern candlestick charting, proper trading using candlesticks started in the 1850s. You may refer this blog on Candlestick Patterns to get a basic idea on candlesticks.
In this blog, our objectives are as follows:
- To plot candlesticks using Python
- To understand a candlestick pattern trading strategy using ‘Three Daily Candles’
To plot candlesticks using Python
We will fetch any relevant daily financial data from the Yahoo database and use it to plot our candlesticks. In this example, we will be plotting daily ‘SPY’ candlesticks. You may change the ticker symbol eg: ‘GOOG’, ‘APPL’, ‘MFST’ etc. and plot your own candlestick chart.

For data visualization, we generally use ‘matplotlib.pyplot‘ library. Matplotlib also provides a small section of special finance plots like candlesticks. Such type of plots are found in ‘matplotlib.finance’ sublibrary.
We will further use Bokeh plots created by using ‘bokeh.plotting’ interface which comes with a default set of tools and default visual styles. Bokeh uses a Python interactive visualization library that targets modern web browsers for presentation.

The output for the above code is as follows:

The tools which we have provided will help you to ‘pan’ the graph and ‘zoom’ in or out using box zoom and wheel zoom. There is also a reset button to show this actual output and the save button will help you to download an image that is shown in your browser (even the zoomed ones).

To understand a candlestick trading strategy using ‘Three Daily Candles’
Let us have a look at a simple daily trading strategy where we will look at the past three days candles and predict whether we will go ‘long’ or ‘short’ on the fourth day. We will close the position before the end of the fourth day and book the profit/loss,
Trading Rules for going ‘Long’ or Buying on the fourth day:
Rule 1: The body of the most recent candle must be greater than the body of the previous two candles irrespective of the colour of the candle.
Rule 2: The second daily candle must be ‘red’.
Rule 3: The ‘close’ of the most recent candle must be more than the close of the second daily candle.
Rule 4: You will ‘buy’ on the morning of the fourth day when the trading starts and ‘sell’ before the market closes.

Trading Rules for going ‘Short’ or Selling on the fourth day:
Rule 1: The body of the most recent candle must be greater than the body of the previous two candles irrespective of the color of the candle.
Rule 2: The second daily candle must be ‘green’.
Rule 3: The ‘close’ of the most recent candle must be less than the close of the second daily candle.
Rule 4: You will ‘sell’ on the morning of the fourth day when the trading starts and ‘buy’ before the market closes.
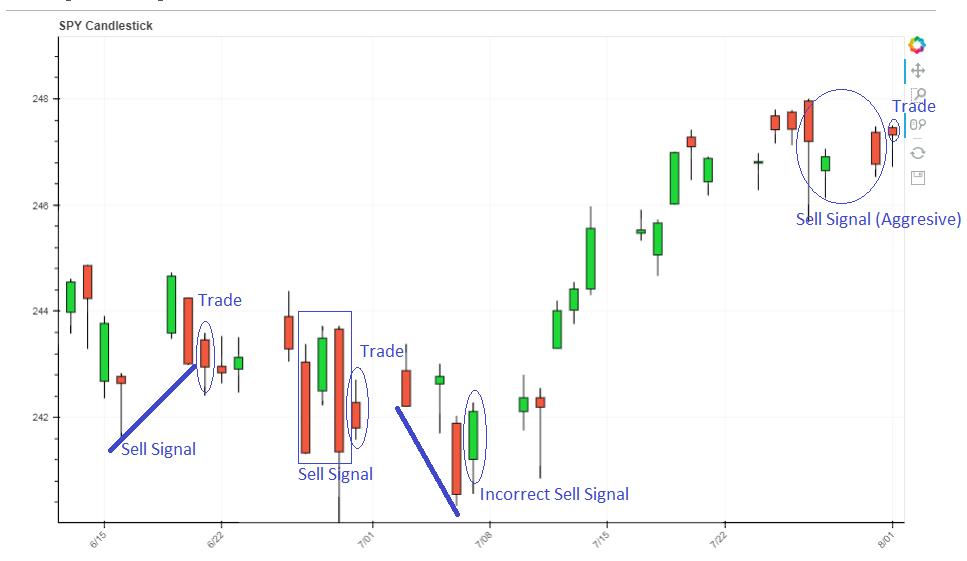
You may relax the ‘buy’ and ‘sell’ signal by not following the rule 3 at some places if the ‘close’ is too near but a more conservative approach would be following all the three steps.
It would be fun if you yourself plot a candlestick chart yourself and try to find ‘buy’ and ‘sell’ signals of the asset which you are considering.
Also, there are various candlestick patterns which you will find online. You may also refer this blog Candlestick Trading – A Momentum Strategy with Example [EXCEL MODEL] and understand the momentum trading strategies where you observe price on the previous ‘n’ candlesticks and make your bets accordingly. An interesting exercise can be trying to find them in the candlestick chart plotted by you.
In addition to this, you can check our blog for articles on different quantitative trading strategies.
But before I conclude, I would like to mention special thanks to Mr. Abhishek Kulkarni for helping me out with the candlestick plotting code.
So good luck and enjoy your candlestick charts.
Next Step
If you are interested in exploring algorithmic trading strategies then do check our EPAT™ program. It covers training modules like Algorithmic & Quantitative Trading, Financial Computing, Technology, Statistics, and Econometrics. EPAT™ equips you with the required skill sets to be a successful algorithmic trader. Enroll now!
Update
We have noticed that some users are facing challenges while downloading the market data from Yahoo and Google Finance platforms. In case you are looking for an alternative source for market data, you can use Quandl for the same.
Download Data File
- Japanese Candlestick Trading Strategy in Python

