
By Priyanka Sah
In our previous article on introduction to Zipline package in Python, we created an algorithm for moving crossover strategy. Recall, Zipline a Python library tailored for trading applications, functions as an event-driven system supporting the execution of both backtesting and live trading using event-driven trading strategies.
In the previous article, we also learned how to implement Moving Average Crossover strategy on Zipline. The strategy code in Zipline reads data from Yahoo directly, performs the backtest and plots the results. We recommend that you brush up a few essential concepts, covered in the previous post, before going further:
- Installation (how to install Zipline on local)
- Structure (format to write a code in Zipline)
In this article, we will take a step further and learn to backtest on Zipline using data from different sources. We will learn to:
- Import and backtest on OHLC data in CSV format
- Import and use data from Google Finance for research/analysis
- Calculate and print backtesting results such as PnL, number of trades, etc
The post serves as a guide for serious quants and DIY Algo traders who want to make use of Python or Zipline packages independently for backtesting and hypothesis testing of their trading ideas. In this post, we will assume that the data is from the US markets. It is possible to use other markets’ data sets for analysis with some edits and additions in the code. We will share the same in a later post.
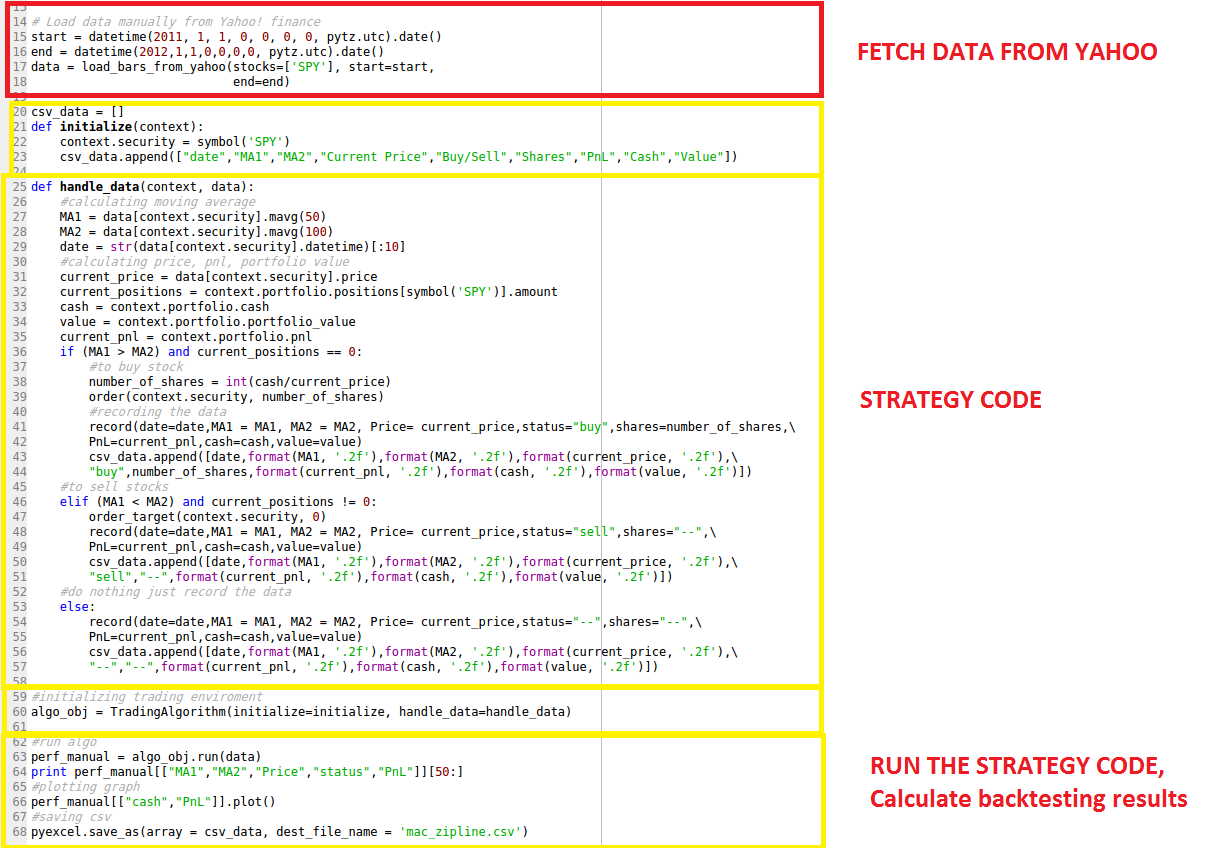
The Parts of the code on Zipline – what we have learned already
The problem with the existing method?
Zipline provides an inbuilt function “loadsbarsfrom_yahoo()” that fetches data from Yahoo in given range and uses that data for all the calculations. Though very easy to use, this function only works with Yahoo data. Using this function, we cannot backtest on different data sets such as
- Commodities data – yahoo does not provide
- Simulated data sets created and saved in csv format
We have been using this inbuilt function so far to load stock data in Python IDE and work further with it. To be able to read csv or any other data type in Zipline, we need to understand how Zipline works and why usual methods to import data do not work here!
Zipline accepts the data in panel form. To understand how Zipline treats and understands data, we must learn a little bit about data structures in Python.
Data Structures in Panda
Pandas structures data in three forms essentially: Series (1D), Data Frame (2D), Panel (3D)
- Series:
It is a one-dimensional labeled array capable of holding any data type (integers, strings, floating point numbers, Python objects, etc.). The axis labels are collectively referred to as the index.
The basic method to create a Series is to call:
s = pd.Series(data, index=index)
A series accepts different kinds of objects such as a Python dictionary, ndarray, a scalar value (like 5).
- Data Frame:
It is a two-dimensional labeled data structure with rows and columns. Columns can be of different types or same.
It is one of the most commonly used pandas objects and accepts different types of inputs such as Dict of 1D ndarrays, lists, dicts, or Series; 2-D numpy.ndarray; Structured or record ndarray; a Series.
- Panel:
A Panel is a lesser used data structure but can be efficiently used for three-dimensional data.
The three axes are named as below:
- items: axis 0, each item corresponds to a DataFrame contained inside
- major_axis: axis 1, it is the index (rows) of each of the DataFrames
- minor_axis: axis 2, it is the columns of each of the DataFrame
Zipline only understands data structure in the Panel format.
While it is easy to import .csv data in Panda as a dataframe, it is not possible to do the same in Zipline directly. However, we have found a roundabout to this problem:

This is a powerful technique which will help you in importing data from different sources such as:
- Import OHLC data in a CSV format in zipline (we will show how)
- Read data from online sources other than Yahoo which connect with Panda (we will show how)
- Read data from Quandl in Zipline (this is left as an exercise for you!)
Let us get started with the three steps!
-
Import the data in python
We can use any method to import the data as a Dataframe or just import the data and convert it into a Dataframe. Here, we will use two methods to fetch data: DataReader & read_csv function.
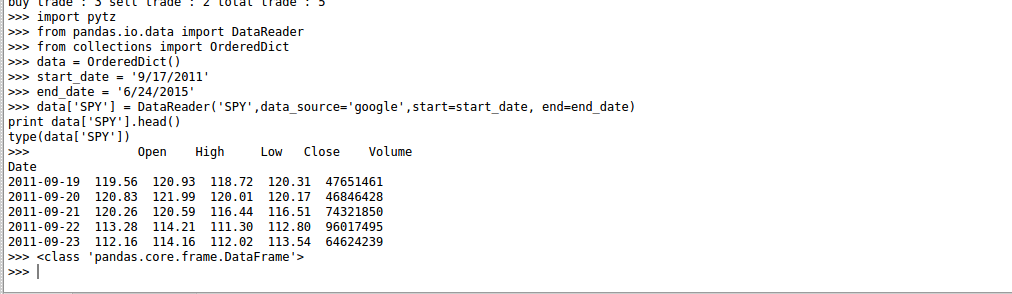
Use DataReader to read data from Google
Pandas provide a function Datareader which allows the user to specify the date range and the source. You can use Yahoo, Google or any other data source.
#code
pip install pandas
import pytz
from pandas.io.data import DataReader
from collections import OrderedDict
data = OrderedDict()
start_date = '9/17/2011'
end_date = '6/24/2015'
data['SPY'] = DataReader('SPY',data_source='google',start=start_date, end=end_date)
print data['SPY'].head()
type(data['SPY'])
This is how a DataFrame looks like when you print the first 6 rows:
Use read_csv function to import a CSV file
Pandas provide another function read_csv that fetches the csv file from a specified location. Please note that the CSV should be in a proper format so that it runs in a correct fashion when called by a strategy algorithm in Zipline.
Format of CSV file:
The First column is the “Date” column, the second column is “Open”, the third column is “High”, the fourth column is “Low”, the fifth column is “Close”, and the sixth column is “Volume”. None of the columns should be blank or with missing values.
Reading CSV file:
#code
import pandas as pd
datas = OrderedDict()
data['SPY'] = pd.read_csv('SPY.csv', index_col=0, parse_dates=['Date'])
print data['SPY'].head()
type(data['SPY'])
Note in the code above:
Name of the stock is “SPY” We are already in the directory where the CSV file “SPY.csv” is saved, else you need to specify the path as well.
-
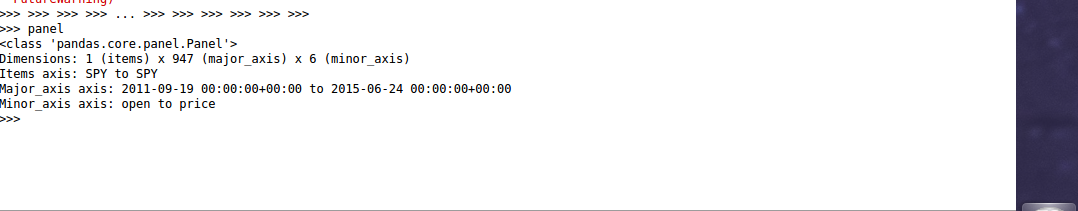
Convert DataFrame to Panel
The data imported in Python IDE by aforementioned methods is saved as a Dataframe. Now we need to convert it into Panel format and modify major and minor axis.
#code
panel = pd.Panel(data)
panel.minor_axis = ['Open', 'High', 'Low', 'Close', 'Volume']
panel.major_axis = panel.major_axis.tz_localize(pytz.utc)
Zipline accepts ['Open', 'High', 'Low', 'Close', 'Volume'] data as minor axis and ‘Date’ as major axis in UTC time format. Since if we did not have the Date in UTC format, we convert it by using “tz_localize(pytz.utc)”.
Now ‘panel’ is the dataset ‘data’ saved in the panel format. This is how a Panel format looks like:
-
Use this new data structure Panel to run your strategy
We use this new data structure ‘Panel’ to run our strategy with no changes in the “initialize” or “handle_data” sections. The strategy logic and code remains the same. We just plug the new data structure while running the strategy.
#initializing trading enviroment
algo_obj = TradingAlgorithm(initialize=initialize, handle_data=handle_data, capital_base = 100000.0)
#run algo
perf_manual = algo_obj.run(panel)
That’s it! Now you can easily run the previously explained Moving Crossover strategy on a CSV data file! Go on, give it a try!
You can fetch the Quandl(US data) data, and try generating signals on the same.
Backtesting on Zipline
In the previous post, we backtested a simple Moving Crossover strategy and plotted cash and PnL for each trading day. Now, we will calculate PnL and the total number of trades for the entire trading period.
Recall that the results are automatically saved in ‘perf_manual’. Using the same, we can calculate any performance ratios or numbers that we need.
#code
#calculation
print "total pnl : " + str(float(perf_manual[["PnL"]].iloc[-1]))
buy_trade = perf_manual[["status"]].loc[perf_manual["status"] == "buy"].count()
sell_trade = perf_manual[["status"]].loc[perf_manual["status"] == "sell"].count()
total_trade = buy_trade + sell_trade
print "buy trade : " + str(int(buy_trade)) + " sell trade : " + str(int(sell_trade)) + " total trade : " + str(int(total_trade))
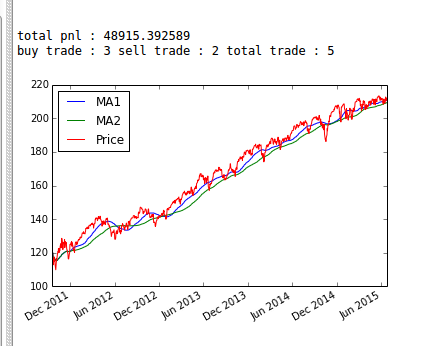
Looks like this strategy lost more than 50% of initial capital!
To change the initial capital and other parameters to optimize your backtesting excel results, you need to initialize the TradingAlgorithm() accordingly. ‘capitalbase’ is used to define the initial cash, ‘datafrequency’ is used to define the data frequency. For example:
algo_obj = TradingAlgorithm(initialize=initialize, handle_data=handle_data, capital_base = 80000.0)
(By default the capital is 100000.0.)
Go through the official documentation of TradingAlgorithm() function to try and learn more!
Our next post introduces you to the zipline package in python with its benefits, how to install it, and using it to code the moving crossover strategy for financial trade.
You can improve your likelihood of success in trading by backtesting your trading rules on historical data. This course on backtesting trading strategies by Quantra is just what you need to get the best out of your trading. Learn everything from the basic steps, data, rules, risk management and more. Enroll now!
Important: We don't recommend using zipline anymore since this library has not been actively managed for the last two years.
Disclaimer: All investments and trading in the stock market involve risk. Any decision to place trades in the financial markets, including trading in stock or options or other financial instruments is a personal decision that should only be made after thorough research, including a personal risk and financial assessment and the engagement of professional assistance to the extent you believe necessary. The trading strategies or related information mentioned in this article is for informational purposes only.
Note: We have noticed that some users are facing challenges while downloading the market data from Yahoo and Google Finance platforms. In case you are looking for an alternative source for market data, you can use Quandl for the same.
Download Data File
- mac_excel_ zipline.txt

