

By Puneet Kinra
What is Dispersion?
In Dispersion or Correlation Trading, Trader keeps a view on Volatility. Volatility mean reverts so Dispersion or Correlation also mean reverts.
Long and short both positions are made on volatilities. To deal with directional risk, Positions are delta neutralize by buying or selling future. So directional risk is limited.
Dispersion is traded by selling Index options and buying stock options or Buying index options and Selling stocks options.
Dispersion Strategy Details
Dispersion trading is hedge strategy to take advantage of relative value differences in implied volatilities between index and index components.
Straddle and strangle combination is made by taking short options positions on an index and a long options positions on the components of the index or vice versa.
By keeping individual stock/index options portfolio delta close to zero, the directional risk is saved on each stock and index option portfolio.

- The profit in dispersion trading comes from the fact that correlation mean reverts and if one has bought correlation then the realized volatilities of an individual stock will be higher in comparison to the realized volatility of the index.
- Index options portfolio and every stock options portfolio is done delta neutral continuously until the position is exited. Here Initial Option position does not change, but we buy or short option’s Index or stock in varying quantities throughout dispersion trade.
Data and Time Frame
The focus of the dispersion trading strategy is Indian Bank Nifty index options and its components bank stocks. We use the 15 minutes data for this strategy. We can also use 30 minutes of data also. It all depends upon, which time frame is giving best results.
Strategy Practical Guideline
Steps taken during the projects are as follow:
Implied Volatility Calculation
To implement this strategy it is important to first calculate the implied volatility of the index Bank Nifty and the stocks in Bank Nifty.
We use Black-Scholes model to calculate the IV’s. We need time to mature, the strike price, the risk-free interest rate, and the current underlying price
Example:
Implied volatility calculation of Bank Nifty and SBIN stock, which is one of the component stocks.

Implied/Dirty Correlation Calculation
We use implied volatility to calculate the implied correlation between stocks. We divide Index IV by weighted Average stock IV to check IC level. If implied correlation is high then there is an indication to sell the index options and buy the stock options and vice versa for low implied correlation.
Example:
Implied Correlation calculation for BANK NIFTY

Selection of Option
We use a combination of straddle and strangle of both puts and calls. Straddle means ATM call and Puts of the same strike. Strangle means OTM calls and Puts. The initial hedge is made to keep delta close to zero by buying or selling relative stock future.
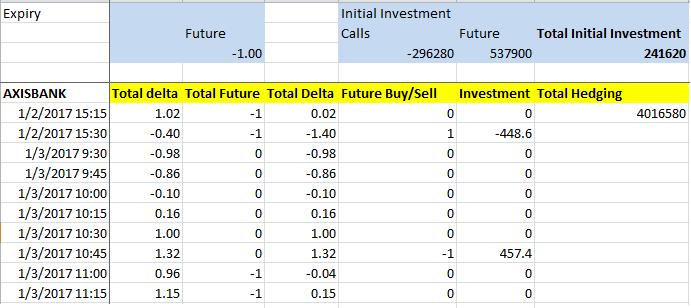
Continuous Delta Neutral/Dynamic Hedging
This is further hedged using future contracts to keep the whole process delta neutral. Delta of this strategy was adjusted every fifteen minutes. When the delta went above 1, one future contract was sold and when the delta dropped to -1 the delta was neutralized by buying one future contract. It is important to keep the delta close to zero for the duration of the trade.
Example:
Continuous delta hedging for AXISBANK stock
Stoploss and Exit
Along with Entry and continuous Delta Neutral, it is also necessary to have a plan to exit from the dispersion trade when the trade moves in our favour and when the trade moves against our expectation. This risk management protects from unexpected loss or by giving up on the profit earned.
Profit and Loss Calculation
The PNL for this strategy is coming from two elements one from Options another from future contracts. The future contracts are added to stay delta neutral. At the time of expiry, all positions are squared off and the final profit is calculated.
Example:
P&L from an individual stock (YESBANK) and the Total P&L of the dispersion trading strategy.

Dispersion Applications
Dispersion trading is a very profitable low risk hedged strategy and rewards are far greater than Risk. If this strategy is traded automatically after backtest, then more efficient results can be generated. This strategy can be used on any traded index where index future is traded and index component options are liquid enough to make the trades. In Indian or Global markets there are a number of indices available that are suitable for correlation/dispersion trading.
Next Step
Dispersion trading is a very profitable strategy which offers high rewards in response to a low risk, but it is essential to implement the strategy correctly to gain the profit. Our next article showcases a project work based on Dispersion trading. This project is part of the EPAT curriculum offered by QuantInsti's algorithmic trading training initiative.
Disclaimer: The information in this project is true and complete to the best of our Student’s knowledge. All recommendations are made without guarantee on the part of the student or QuantInsti®. The student and QuantInsti® disclaim any liability in connection with the use of this information. All content provided in this project is for informational purposes only and we do not guarantee that by using the guidance you will derive certain profit.
Files in the download:
- Dispersion Trading On NSE Stocks - Excel Sheet

