
This article is designed to provide you with an understanding of upskilling yourself as a quant. You will find relevant information to better yourself with regard to analysing the market data on a regular basis and to create algorithmic models for risk management, portfolio optimization etc.
This article covers:
- Who are quants?
- Relevance of quantitative finance
- Most common ways to upskill as a quant
- Trading in a challenging environment
Who Are Quants?
A quant is a person who specializes in the application of mathematical and statistical methods to understand and predict the behaviour of the financial markets. A quant aims to represent a given market situation in terms of numerical values.
Quants are required to have quantitative skills in the field of mathematics which includes multivariate calculus, linear algebra, differential equations, probability theory and statistical inference. Moreover, it also includes econometrics and the knowledge of programming languages such as C, python etc.
Going forward, let us find out the relevance of quantitative finance for a quant.
Relevance of Quantitative Finance
Quantitative Finance, also known as mathematical finance, is a field of applied mathematics that primarily deals with financial markets. Quantitative finance possesses a close relationship with financial economics and covers many financial applications of quantitative topics such as statistics, probability theory, sampling and estimation, hypothesis testing, regression, time series etc. Quantitative finance techniques are employed in investment banking, derivatives trading, securities trading, risk management and portfolio management.
Let us now find out the most common ways the quants can upskill in their field.
Most Common Ways to Upskill as a Quant
As a quant, there are certain common ways of upskilling in your role. Undoubtedly, a quant is needed to do the routine work of:
- Trading strategy development
- Optimization of portfolio
- Risk management
- Asset pricing and management
Trading strategy development
Developing a trading strategy implies planning the trades for executing them at the most profitable times. The specifications in the trading strategy development are: when to enter the market, when to exit, which trades to make and how much capital to risk on each position.
Optimization of portfolio
Portfolio optimization includes setting the best portfolio with a combination of investments such as stocks, commodities, options, derivatives etc. This way, the investor can maximize the return on the investment with the existing risk in the market.
Risk management
Apart from using the standard risk modelling, quants basically choose from the several orders for minimizing the risk on the return of an investment. For instance, orders such as a hard stop loss based on metrics like portfolio loss percentage or ATR, a limit order which implies buying at no more than a decided price and selling at no less than a specific price. There are certain other order types which a quant can implement for helping with risk management.
Asset pricing and management
Asset pricing implies making the investments keeping the risks associated with the same in check. Be it a portfolio optimization of pricing of a security, quants make sure that there is a maximum return on the investment.
Now, to upskill as a quant or to simply become a better one, following are the areas you need to put emphasis upon:
- Forward-looking trading
- Scenario analysis
- Geo-political considerations
- Alternative data
Forward-looking trading
The quants need to anticipate future markets conditions on the basis of various factors. Current positions will only yield favourable returns if future outcomes are reasonably predicted. Such predictions can be better assessed with the help of machine learning and deep learning models. For instance, Regression helps with acquiring the data, pre-processing it, training as well as testing the machine. Another example is the Support Vector Machine model which also helps to create your own prediction algorithm. While a regression model is best for unstructured or semi-structured data like texts and images, the regression model is made to learn with identified independent variables. There are several other machine learning and deep learning models which can help with a gainful trading.
Scenario analysis
Scenarios analysis is done taking into account various possibilities which can affect the positions of the trader.
Such possibilities are several macro-economic factors which can affect the markets conditions.
For instance, in case of negative crude oil prices, the domestic as well as international markets are affected. This recently happened in March 2020 when the price war between oil giants Saudi Arabia and Russia sent the oil prices in negative. It was the same time when Dow plunged by over 1,200 points over the following two days and brokerage firms took multimillion-dollar hits to cover customers’ losses.
Accordingly, a quant can analyse the market on the basis of the impact of such a scenario on the industries or companies and plan the investments.
Geo-political considerations
Geo-political considerations such as Hong Kong security law sensitise the financial markets. Many companies are planning to shift their bases out of Hong Kong in order to protect their rights.
Hence, these aspects can considerably put an impact on the stocks’ positions and the quant should look out for these contingencies.
Alternative data
Alternative data sets basically provide the information with regard to unique insight into investment opportunities. This essential information which helps with finalising the investments is published/distributed by the company or sources outside the company. Quants can base their investment decisions after analysing the conditions in the market.
J.P morgan mentioned that asset managers are investing $2-3 billion on acquisition and processing of alternative data according to the sources of Deloitte.
For instance, information regarding the company’s shipping, pricing, internet activity etc. on platforms such as Twitter, LinkedIn and so on. Other sources of procuring information can be credit card transactions, point-of-sale transactions, email receipts etc.
Going forward, let us take a look at what to consider while trading in a challenging environment.
Trading in a Challenging Environment
For dealing with a challenging environment such as a pandemic, quants need to be well equipped with tools so as to take positions according to the fluctuations in the market. These important tools are:
- VIX indicator
- Bollinger bands
- MACD
- CAPM
VIX indicator
VIX or the volatility index is basically a measure to find out the market volatility and hence, is also known as “fear-index”. A quant can use it to track down the investor fear with regard to future volatile markets. With VIX, a quant can measure the market’s speculated volatility on S&P 500 Index Options. Below is the image of the VIX indicator which shows how the indicator looks. The indicator is showing VIX going up where the crisis is occurring. For instance, the financial crisis of 2008-09. With VIX, a quant can assess the market.
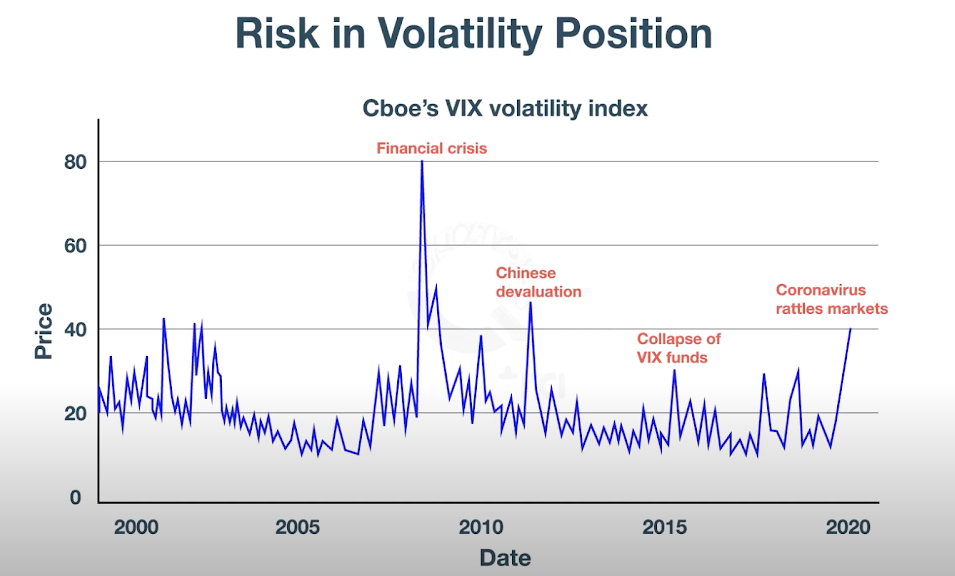
Source: Trading Using Options Sentiment Indicator
Bollinger bands
Bollinger bands oscillator is volatility or standard deviation based oscillator which comprises of three components. The middle band is a moving average line and the other two bands are predetermined, usually one standard deviation away from the moving average line.
Bollinger bands involve the following calculations:
- Middle Band: 30 Day moving average
- Upper Band: Middle Band + 1 x 30 Day Moving Standard Deviation
- Lower Band: Middle Band – 1 x 30 Day Moving Standard Deviation
As a quant, you can use bollinger bands to determine the volatility of the stock prices. As soon as the volatility of the price changes, the gap between the bands also changes. During more volatile markets the gap widens and amid low volatility conditions, the gap contracts. When the band is wider with high volatility, there is an instability in the market. That is when a quant should be taking advantage of the market conditions. For instance, with such a market the quant can help to make the most out of, say, options. There can be various strategies to make the most out of the volatile market condition. Usually in a high volatile market, the options premium tends to be priced higher because of the underlying asset price fluctuations.
Moreover, it is very important that the crossover of complete candle happens.
It is clearly visible in the chart below when the prices continually touch the upper band, the asset is usually in an overbought condition, conversely, when prices are regularly touching the lower band, the asset is usually in an oversold condition. Here, overbought implies the over pricing of the stocks, whereas, oversold indicates the under pricing of the stocks.
These overbought and oversold indications shouldn’t be interpreted as direct buy/sell signals. Though, they can be a part of the signal generating decision process.

MACD
Moving average convergence divergence indicator is another tool to help a quant decide the best position in the market. Convergence implies that the trend will continue, whereas divergence shows that a trend reversal is expected. A convergence and divergence analysis requires you to analyse price changing points over a period of time.
In simple words, it needs you to pay attention to the turning points in prices over a period of time. In divergence, there is always the presence of increased volatility which makes for frequent profitable opportunities.
MACD helps you to understand the market behaviour with which you can get a future estimate more accurately. In the working of MACD, Exponential Moving Average and Simple Moving Average are used. Let us take a look at the graph below:
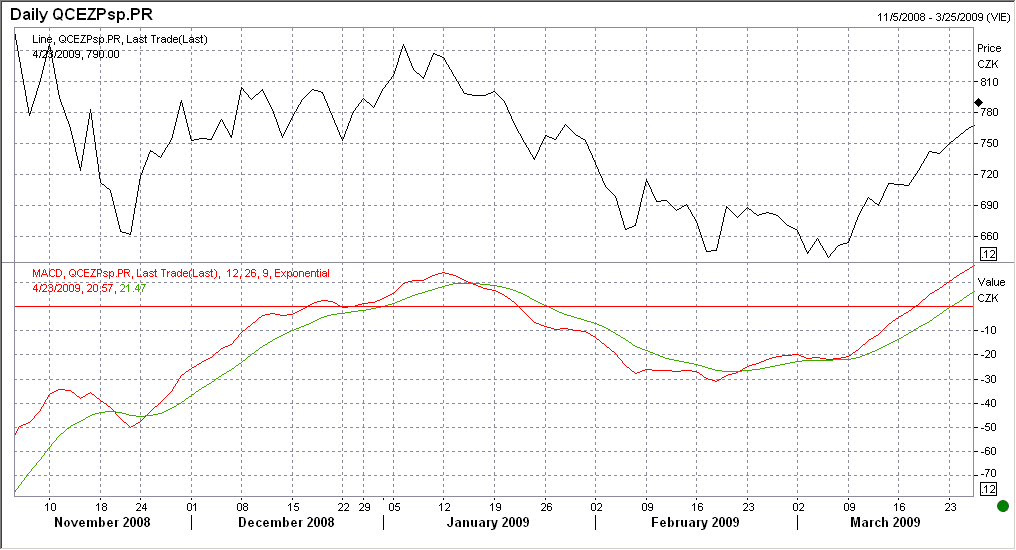
The classic setting keeps EMAs as 12 and 26, whereas SMA is set at 9. You can take them as it is or you can choose any other values depending on the trading preference.
With this oscillator, convergence happens when the moving averages move closer to each other.
Conversely, divergence happens when the moving averages move away. Moreover, the Indicator is above 0 when the 12-period EMA (shorter period) is above 26-period EMA (longer period). Whereas, it is below 0 when the shorter 12-period EMA is below the longer 26-period EMA. This implies that positive values indicate a bullish market and negative values point toward a bearish market.
With the indication of a bearish market, a quant can take the steps accordingly. For instance, a quant can utilise the futures contract in case of a bearish market and make the global firm/hedge fund be safe against the potential losses.
Further, considering the whiplashes is extremely important. Whiplashes imply the breakout from the support/resistance price. The breakout can be to the downside or the upside.
It will be more clear with the image below, which shows breakout to the downside after which there is a moving back of the price to the support level from where the breakout took place.
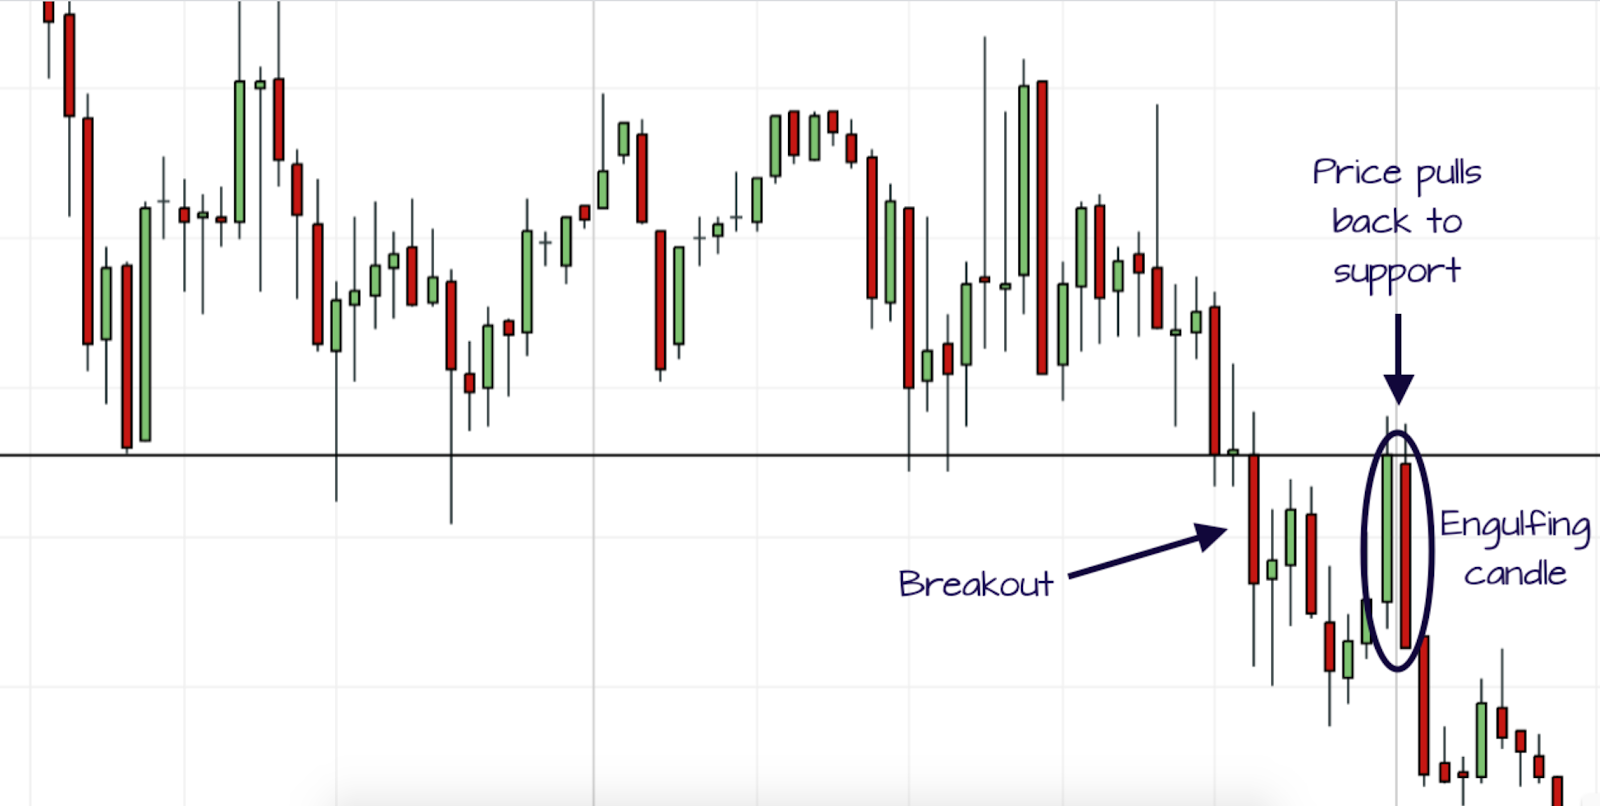
Source: Trader’s Bulletin
Conversely, there is a breakout to the upside also, which you can see in the image below.
The breakout is followed by a pull back to the support/resistance level from where the breakout emerged.
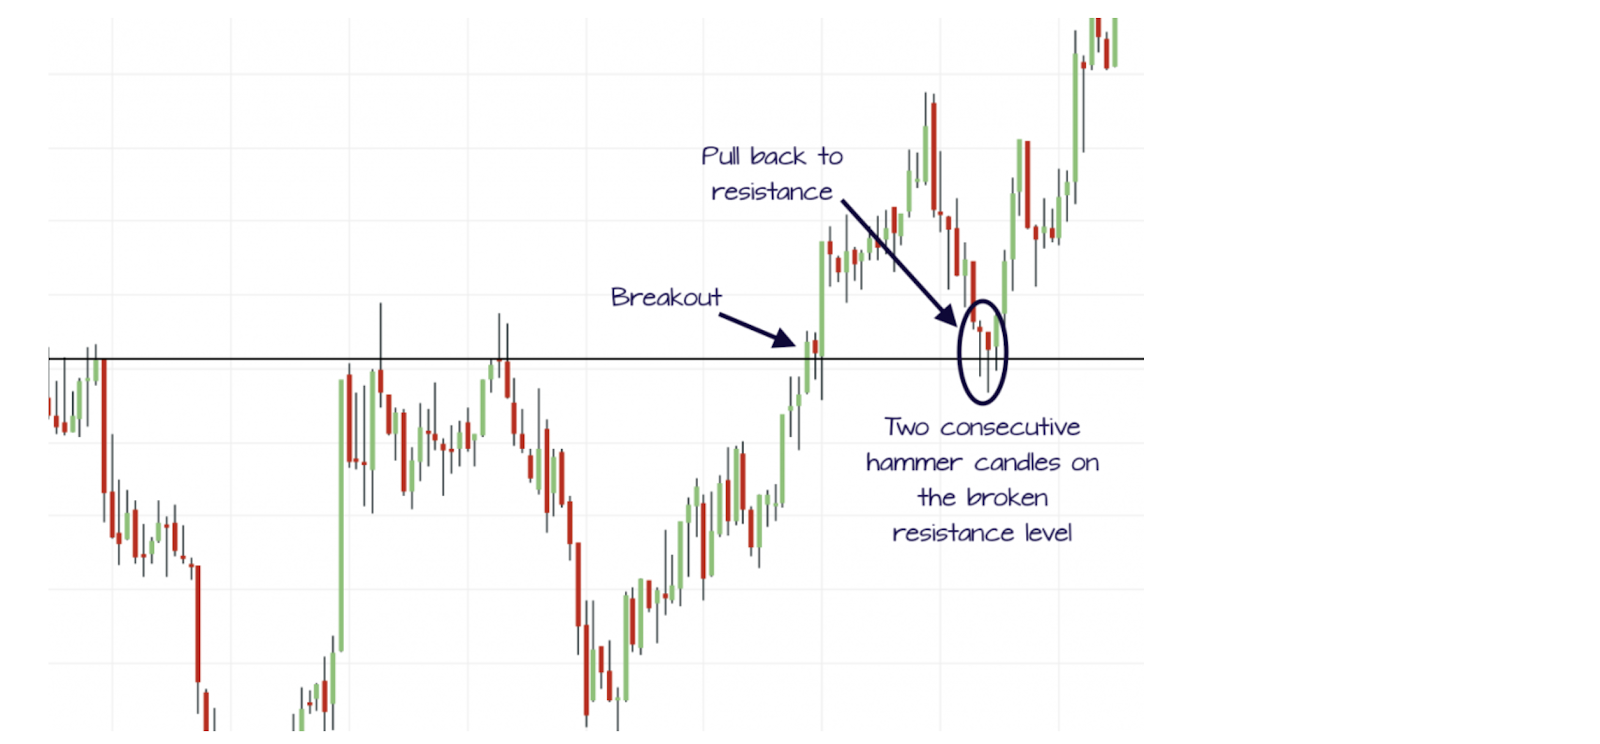
Source: Trader’s Bulletin
A quant also must consider these whiplashes in the MACD to find out the volatility level in the market. In such a scenario, a quant must make a wise decision of waiting for the rebound of the prices so as to enter a less volatile market with a better price.
CAPM
CAPM or capital asset pricing model is the relationship between the estimated return on the investment in the market and the risk associated. A quant can utilise this model for asset pricing in a challenging market. If the market is too risky, a quant can analyse whether the investment is worth the risk or not by comparing the amount of estimated gains on the investment with the risk. If the estimated risk is more, the estimated return also needs to be higher.
The formula for CAPM which gives you an estimated return on investment for you to be able to decide which option is more profitable is:
Ra = Rf + 𝝱 * (Rm - Rf)
In the formula above,
Ra = Estimated return on the investment
Rf = The Risk-free rate of return on an investment
𝝱 = Beta value or risk value of investing in financial asset
Rm = Average return in the capital market
The risk of investing in that asset (𝝱) is multiplied with the market risk premium i.e., (Rm - Rf) to get the amount over and above the risk-free return which you will get if you invest in a risk-free financial asset.
And, adding the output with the risk-free rate of return on investment in any other financial asset in the market will give you the premium (total estimated return) you get rewarded with for bearing that risk.
This was all about performing the roles in a challenging environment as a quant.
As a quant, in case you have any further apprehensions about scaling up in the role, feel free to check out the success story of a successful Quant Eriz Zárate and learn about his successful journey.
Conclusion
A quant jobs is in itself pretty interesting with all the important activities to perform on a daily basis. In this article, we mainly discussed the ways in which a quant can upskill and reach the next best level in his/her career. Moreover, trading in a challenging environment is another important aspect we looked at in the article and discussed the ways to do so.
All investments and trading in the stock market involve risk. Any decisions to place trades in the financial markets, including trading in stock or options or other financial instruments is a personal decision that should only be made after thorough research, including a personal risk and financial assessment and the engagement of professional assistance to the extent you believe necessary. The trading strategies or related information mentioned in this article is for informational purposes only.

